
Wedding guest travel emissions are often a large share of a wedding’s climate footprint, and also the piece couples are most tempted to measure with false confidence. This guide shows how to build an honest estimate: a travel emissions worksheet where every number carries a label for how well you know it, a low-central-high range instead of a single figure, and a plain statement of what the travel emissions result can and cannot tell you.
Estimate travel emissions in five steps. Group guests by where they start and how they will probably travel. Multiply distance by a published emission factor for each group. Label every input as known, assumed or guessed. Run a low, central and high version using stated uncertainty. Then report the travel emissions range, name the biggest driver, and use it to compare choices rather than to claim a precise total. If one group of long-distance flyers dominates the travel emissions result, no amount of fine tuning elsewhere will change the picture.
Somewhere in most sustainable wedding conversations, someone says that the flights alone dwarf everything the caterer and florist could do. That is often true, and it is also where the trouble starts. A couple who believes it feels pulled toward a number: “our wedding produced this many tons.” The number looks authoritative. It is usually built from a guessed guest list, a guessed route and a factor borrowed from a website that did not say what it assumed. This guide is about producing a figure you can defend, or at least describe honestly, and about knowing when to stop refining.
Wedding guest travel emissions are the greenhouse gases released by the trips people take to reach the wedding and get home again. That includes flights, drives, trains, buses, rideshares and the shuttle between the hotel and the venue. It does not include the food, the venue’s energy use, the flowers or the dress, which are separate questions covered in the guide on reducing wedding waste from catering to cleanup. Travel is its own category because it follows different rules: it depends on choices made by dozens of other people, and you control very little of it.
A note on scope. This is general information, not legal, tax or financial advice, and it is not an emissions audit. The factors, tools and methods mentioned here are published by agencies and standards bodies that update them, so check the current versions before you rely on any number.
What a wedding guest travel emissions estimate is for
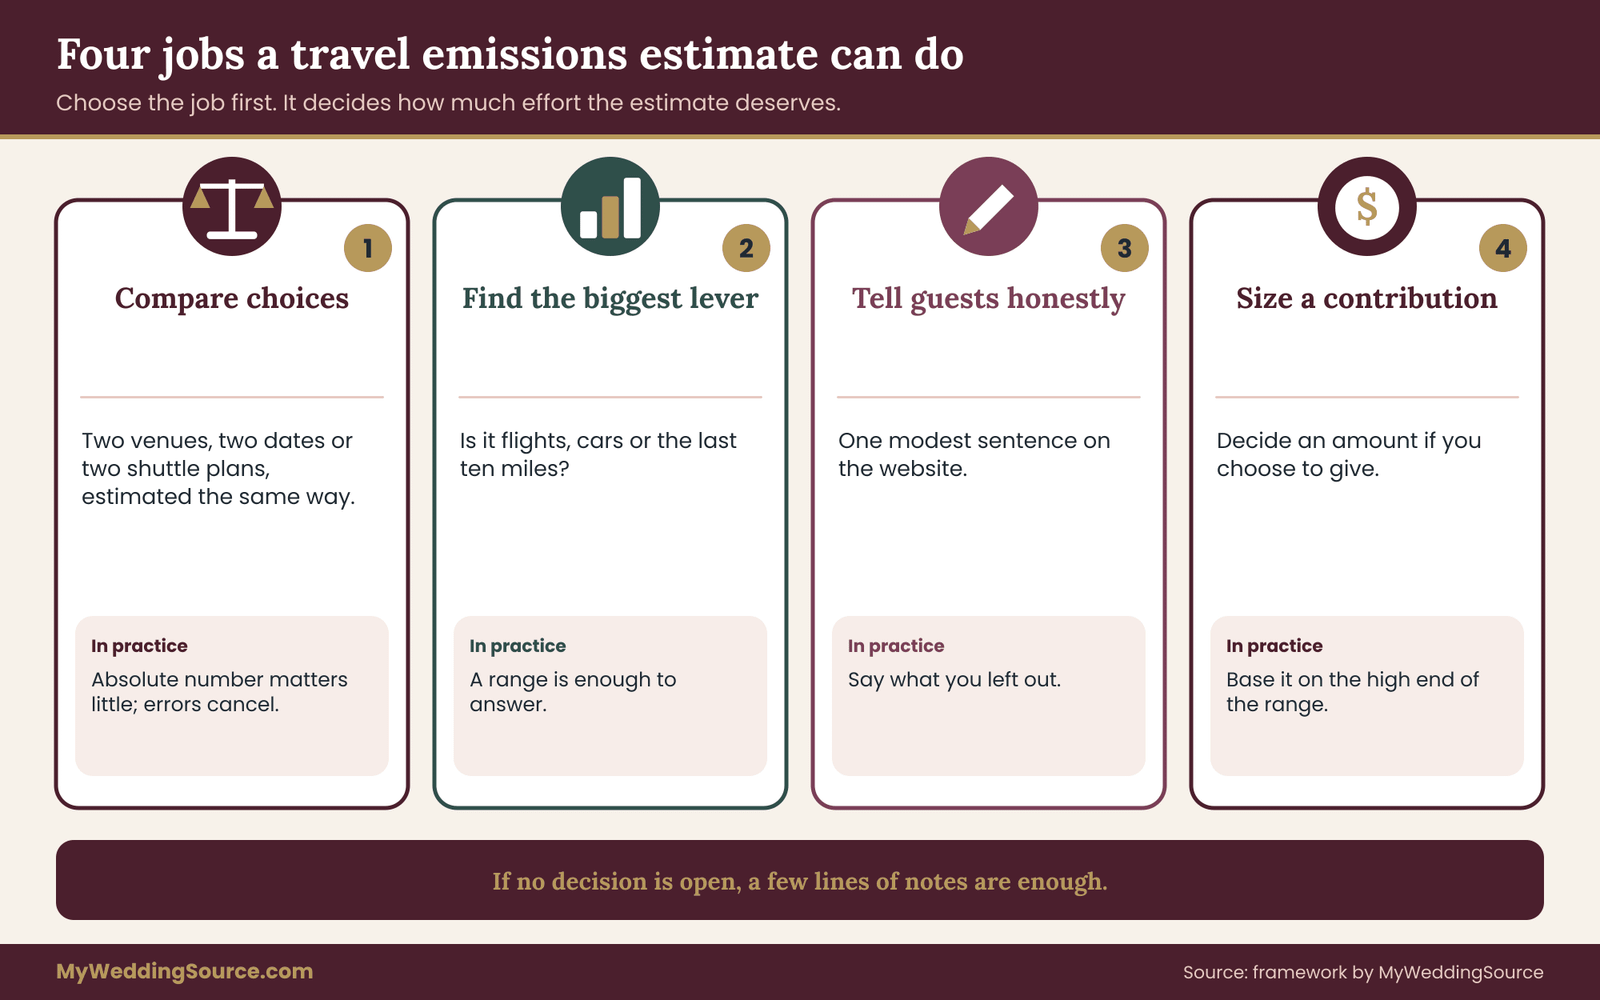
Before choosing a method, decide what the travel emissions estimate is supposed to do. The same worksheet can serve four quite different purposes, and the purpose decides how much effort is worth spending.
Comparing choices. You are weighing two venues, two dates or two shuttle plans, and you want to know which produces less travel. For this purpose the absolute number barely matters. What matters is that both options are estimated the same way, so errors cancel out. This is the strongest use of an travel emissions estimate, and it is where a rough worksheet earns its keep.
Finding the biggest lever. You want to know whether the problem is mostly flights, mostly cars, or mostly the last ten miles. A range is enough to answer that. If flights account for the bulk of the central travel emissions estimate and still account for the bulk in the low and high cases, you have your answer without needing a precise total.
Telling guests something honest. You may want to say a few words on the wedding website or in a toast about travel. The standard here is not precision but accuracy about uncertainty. “We estimate the travel emissions at roughly this range, mostly from flights” is a defensible sentence. “Our wedding emitted exactly this much” is not.
Deciding whether to offset or contribute. Some couples consider paying toward a climate project. An estimate informs the size of that decision, but it does not make an offset’s claims true. The section on public statements later in this guide covers the Federal Trade Commission’s guidance on environmental claims, which applies to marketing and is a useful discipline for private statements too.
If none of these purposes applies, you may not need a travel emissions estimate at all. Curiosity is a fine reason, but it deserves a lighter touch than a decision does.
Why precision is the wrong goal
The honest sources of error in a wedding travel estimate are large, and most of them cannot be removed by working harder. You do not know who will attend until the RSVP deadline passes, and some people will change their plans afterward. You do not know whether a guest flying in will share a rental car, stay with family or take a train from the airport. You do not know the aircraft type, the cabin class or how full the plane will be. You do not know whether the guest drives a compact hybrid or a large pickup.
Each of those unknowns shifts the result by tens of percent. Stack several together and the true figure for your wedding might sit anywhere in a range that spans a factor of two. A single number printed to the last digit hides that range. It also invites a second mistake: treating a small difference between two options as meaningful when it falls well inside the noise.
The practical response is not to give up. It is to be explicit. A worksheet that labels every input and carries a low and high case forward makes the uncertainty visible, and it often shows that the decision is clear even when the travel emissions total is not.
What this guide does not cover
This guide stays with travel. It does not tell you how to cut waste at the reception, how to price an offset, or how to certify a wedding as sustainable. It also does not argue that guests should stay home. Plenty of couples decide that having family in the room matters more than the carbon cost of reaching it, and that is a legitimate choice. The aim is to make the cost visible so that the decision is informed, not to prescribe the outcome.
If you are still choosing the broad shape of the wedding, the wedding planning checklist puts travel-related decisions such as date, location and guest count in order, and those choices drive nearly everything below.
Why false precision hurts a wedding travel emissions estimate
Fake precision is not just a style problem. It causes specific harms, and naming them helps you avoid them.
First, it distorts decisions. Suppose one worksheet says the destination option emits eleven percent more than the home-town option. If the uncertainty on each is thirty percent or more, that difference is meaningless, but a precise-looking number invites you to act on it. Meanwhile the real signal, such as a handful of intercontinental flights, goes unremarked because it is buried in a column of decimals.
Second, it creates a false audit trail. A figure with two decimal places looks as if it came from measurement. If you later quote it to guests or in a social post, readers assume the same. Someone who knows the field will notice the missing assumptions and wonder what else was overstated. A modest, labeled range protects your credibility far better.
Third, it misdirects effort. Hours spent finding the exact distance between a guest’s house and the airport are wasted when the guest has not decided whether to fly. The effort belongs on the few assumptions that move the total, which the travel emissions worksheet in the next sections helps you find.
Fourth, it can slide into greenwashing. Environmental claims can mislead through omission as easily as through exaggeration. The Federal Trade Commission’s Green Guides describe how marketers should avoid unqualified or overstated environmental claims. They are written for commercial marketing, not for couples, but the principle transfers: say what you measured, say what you left out, and do not imply a benefit you cannot support.
The three honest sentences
A useful habit is to write down, before you start, the three sentences you hope to be able to say at the end. For example: “Most of our wedding guest travel emissions come from a small number of long flights.” “Moving the ceremony to the other city would reduce the travel emissions total by a large amount, a small amount or about nothing.” “We left out the honeymoon, the rehearsal dinner trips and anything the vendors traveled.” If your worksheet cannot support sentences like these, adjust the travel emissions worksheet, not the sentences.
A quick test for any number you see
When you meet a figure about wedding travel, in an article, an app or a vendor brochure, ask four questions. What exactly is counted, and what is left out? Which emission factor was used, from which publisher and which year? Is the number a measurement, an travel emissions estimate or a guess? And what range would the author accept as reasonable? If the source cannot answer, treat the figure as an illustration, not as evidence. The same questions apply to this guide’s own worked example, which uses invented round numbers on purpose so that nobody mistakes it for data.
Setting the boundary for wedding guest travel emissions
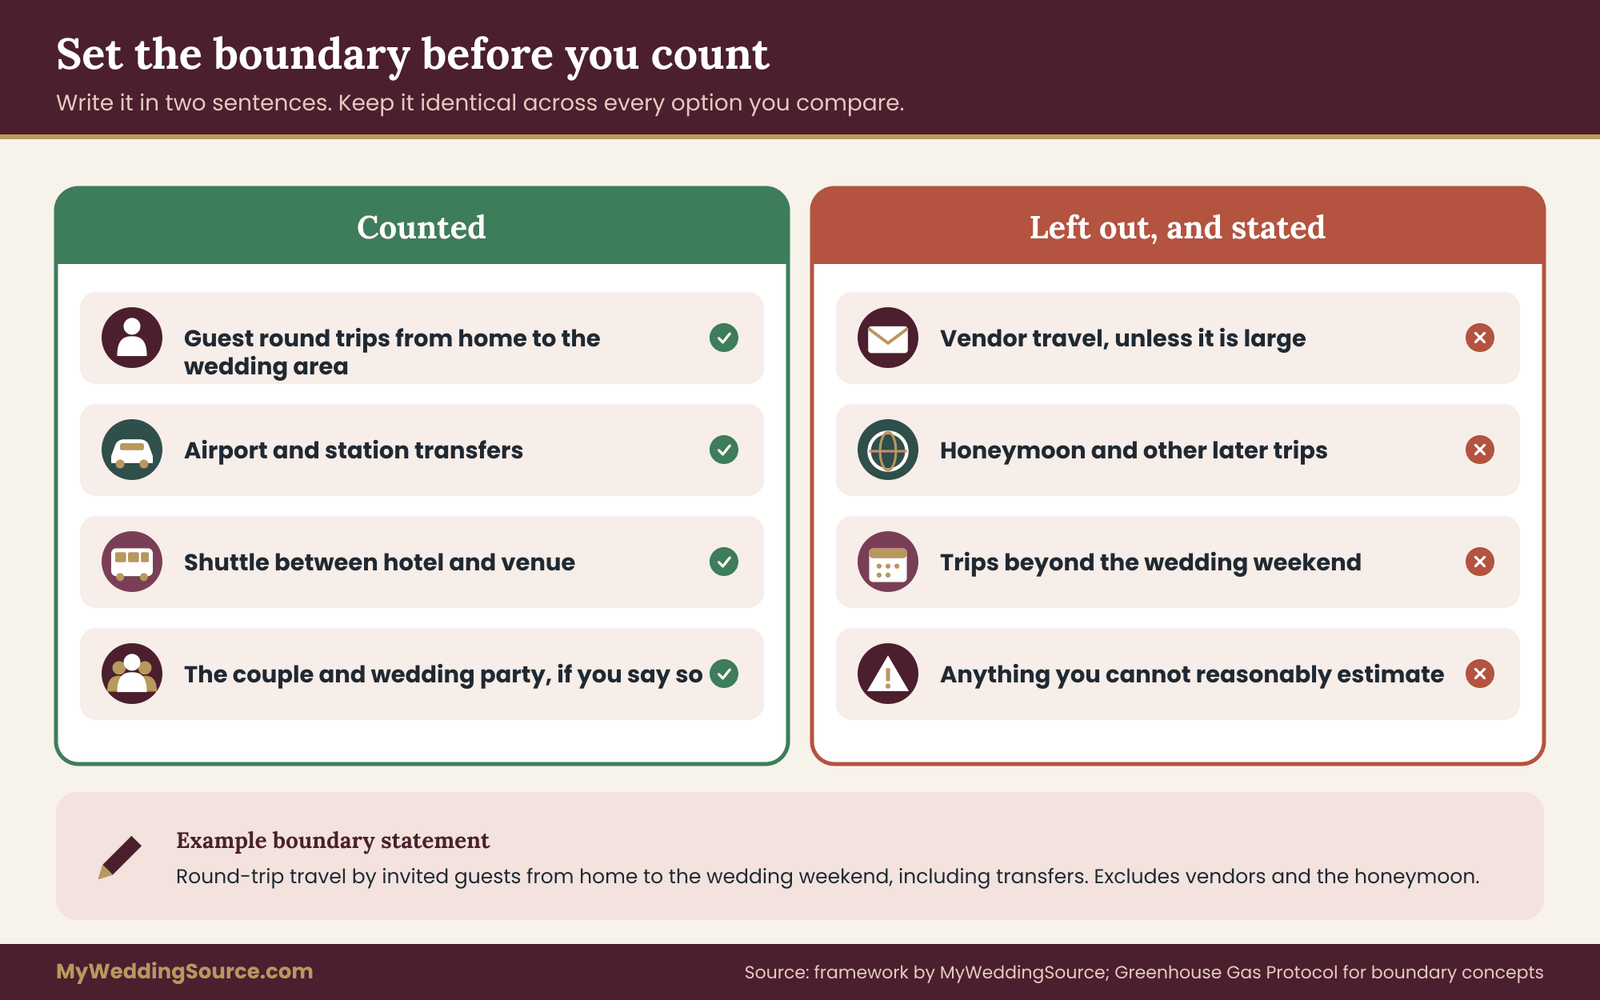
An estimate is only as good as its boundary, the line that separates what you count from what you leave out. Decide the boundary first, write it down, and keep it the same across every option you compare. The boundary is where most worksheets quietly go wrong, because two people can both say “guest travel” and mean different things.
Which trips to include
Start with the core: each guest’s round trip from the place they leave to the place they sleep or celebrate, and back. For most weddings this means home to airport, flight, airport to hotel or venue, and the return. Add local movement during the wedding weekend only if it is large enough to matter, such as a shuttle running all day between two sites.
Then decide on the edges, and be consistent.
The couple and the wedding party. Count them or not, but say which. Many couples include everyone who travels because of the wedding, including themselves. The difficulty is that the couple’s travel to the venue may be a few miles while a bridesmaid flies across an ocean. Including everyone gives a fuller picture. Excluding the couple and vendors gives a “guest” figure that is easier to compare across weddings. Either is acceptable if stated.
Vendors. A photographer driving two hours, a band flying in with equipment and a florist hauling a van are all wedding travel. Most couples exclude vendors from a guest estimate and mention the exclusion. If you chose a destination venue and brought your own team, vendor travel may be too big to ignore. The vendor due diligence checklist is a good place to ask about travel and lodging fees, and those answers double as inputs here.
Pre- and post-wedding events. The rehearsal dinner, the welcome drinks, the next-day brunch and any pre-wedding trip add legs to some guests’ journeys. If the guests are already in town, the extra emissions are small. If an event is in a different city, it is a separate trip and belongs in the count.
The honeymoon. Treat it as its own trip. It is not guest travel, and folding it in blurs the comparison between wedding venues.
Guests who extend their stay. A guest who flies in for the wedding and stays another week to tour the region made one wedding trip and then a vacation. Attributing the whole flight to the wedding is a reasonable simplification, because they would not have gone otherwise. If a guest was already traveling in the area for other reasons, the wedding’s share is smaller. Neither case is knowable with confidence, so treat the whole flight as counted and mention the simplification.
Which gases and which scope
Travel emissions are normally reported in carbon dioxide equivalent, often written CO2e, which converts other greenhouse gases into the amount of carbon dioxide that would have a comparable warming effect over a stated period. For a couple’s worksheet, you do not need to compute this yourself. Published emission factors already report CO2e or CO2 and say so. Just keep the same unit throughout and name it.
Aviation has a further complication. Aircraft emissions at altitude can warm the climate through effects beyond the carbon dioxide from burning fuel, such as contrails and other chemistry. Different calculators handle this differently. Some report only fuel-based CO2, some apply a multiplier. When you pick a factor, note which approach it uses and whether it includes any such adjustment. Two calculators can disagree for this reason alone, which is another argument for ranges.
Attendance versus invitations
Your invitation list is not your attendance. Estimate on the number of people you expect, then run the travel emissions range on a lower and a higher attendance. A guest who accepted but cannot fly because of a conflict, or a plus-one who was never counted, can alter the travel emissions total. The wedding RSVP etiquette guide covers collecting replies, and its principles help here, because a clean RSVP list is the foundation of a clean travel emissions estimate.
Writing the boundary statement
Put the boundary in two sentences at the top of your worksheet. Example: “This estimate covers round-trip travel by invited guests and the couple from their home area to the wedding weekend location, including airport and station transfers. It excludes vendor travel, honeymoon travel and any trips beyond the wedding weekend.” That statement does more work than any amount of arithmetic. It tells you and any reader what the number means, and it stops the figure from drifting when someone adds a new case later.
Collecting guest data without prying
Good estimates need location and travel-mode information, and guests are right to be wary of handing it over. A guest’s home address and travel plans are personal data. Treat them accordingly and collect only what the travel emissions estimate needs.
What you actually need
For each household or party, you need three things. The first is the origin, but only at a coarse level: city, metro area or even a distance band, not a street address. The second is the likely mode: fly, drive, train, bus or already local. The third is the party size, meaning how many people share the trip, since a car carrying four people emits roughly the same per vehicle-mile as a car carrying one.
You almost certainly already hold most of this from the guest list and address spreadsheet. If you built a wedding guest list with household addresses, you can derive the origin band from the mailing address without asking anyone anything new.
Reduce what you keep
Work with approximations and discard detail you do not need. A practical method is to convert each address to a distance band right away, and then work only with the bands. For example: under thirty miles, thirty to one hundred fifty, one hundred fifty to five hundred, and over five hundred. Within the longest band you may split further by region or country, because a transatlantic flight and a cross-country flight are very different. Keep the travel emissions worksheet itself free of names. Label groups “Group A, local drivers” rather than listing who is in each.
If you want actual travel plans, such as whether someone intends to fly, add one optional question to the RSVP form or website: “How are you planning to travel? A rough idea is fine.” Make it optional and explain why in one sentence. Many guests will answer, and the non-answers can be filled by assumption. Do not ask for flight numbers or itineraries. You do not need them, and collecting them makes guests uncomfortable.
Sample wording for the optional question
On a wedding website or RSVP form, plain wording works best. Something like: “We are curious about how far everyone is traveling so we can plan shuttles and think about the environmental cost. If you are comfortable, tell us roughly how you expect to arrive. Skipping this is completely fine.” Keep the tone friendly and make clear that nothing is expected or judged. A guest who is flying because of a relative’s illness, or driving because they cannot afford a flight, should never feel graded.
This is also an equity matter. Guests who travel farthest are often the people who most wanted to be there and who are spending the most to come. If your wedding website talks about sustainability, avoid language that makes long-distance guests feel like the problem. Keep any conversation about who pays for travel private and voluntary, and keep it separate from the carbon question.
Handling the missing data
Plan for gaps from the start. A reasonable rule is that any household with no information gets assigned the most common mode for its distance band, flagged as assumed. Do not try to chase every unknown. If 70 percent of your long-distance guests clearly will fly, assigning the rest to flying is a better default than leaving them out. The travel emissions worksheet’s label column will record each of these decisions, so you can see later how much of the travel emissions total rests on assumptions rather than on what guests told you.
Keeping the data safe
Store the grouped worksheet on your own device or account, share it only with your partner and anyone helping with the travel emissions estimate, and delete the address-level source data once the groups are built, unless you still need it for other purposes such as invitations. A worksheet that contains no names and no addresses can be shared freely, which is a side benefit of grouping early.
The assumption-labeled worksheet for travel emissions
This is the center of the method. The travel emissions worksheet is a set of rows, one per guest group, with a fixed set of fields. The distinguishing feature is a label on every input saying how well you know it. That label is what keeps the travel emissions worksheet honest, because it forces you to notice when a number is a guess dressed as a fact.
The three labels
Every input in the travel emissions worksheet gets exactly one of three labels.
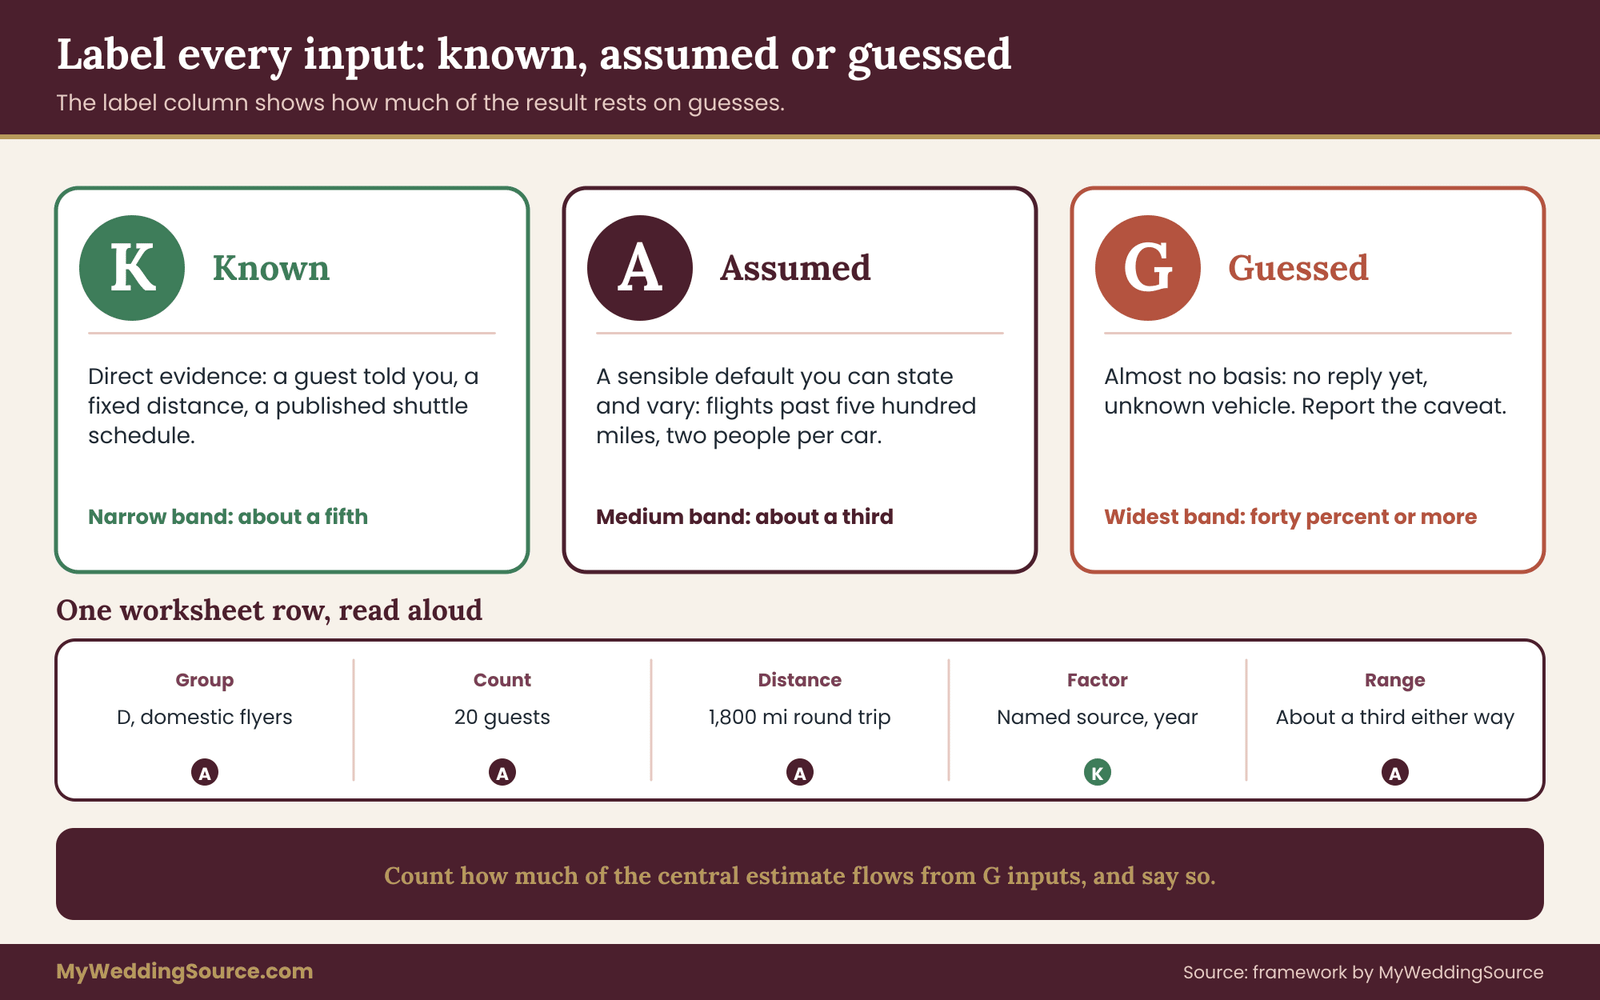
K, known. You have direct evidence. The guest told you their plan, you can measure the distance on a map between two fixed points, or the venue published the shuttle schedule. Known inputs still have small errors, but they are the firmest ground.
A, assumed. You are applying a sensible default. For example, you assume guests in the over-five-hundred-mile band will fly because driving that far for a weekend is unusual, or you assume two people per rental car. Assumed inputs rest on reasoning you can state, and you can vary them.
G, guessed. You have almost no basis. A guest has not replied, you do not know whether they have a car, or you are estimating attendance from last year’s pattern. Guessed inputs are allowed, but they should shrink in importance as the travel emissions worksheet matures, and any result that depends mostly on G inputs should be reported with that caveat.
Labeling is cheap. Add a column of letters beside each cell. At the end, count how much of the central travel emissions estimate flows from rows with G labels. If that share is large, say so, and spend your remaining effort on turning those guesses into assumptions or knowns.
The fields in each row
Think of each row as a short sentence you could say out loud: “Group C, twenty guests, flying, about eighteen hundred miles round trip each, using the aircraft factor, with an uncertainty of about a third.” The fields are:
- Group name and head count. Who, and how many people. Label K, A or G.
- Origin band. A city, region or distance band. Label.
- Mode. Fly, car, rail, bus, rideshare, shuttle or on foot. Label.
- Sharing. For cars: people per vehicle. For other modes: nothing, since factors are per passenger. Label.
- Round-trip distance per vehicle or passenger. Miles or kilometers. Label.
- Emission factor and source. A named factor from a named publisher and year. Label by how well the factor matches the situation.
- Central estimate. Distance times factor, times head count or vehicles.
- Low and high. The same calculation with each uncertain input moved in the direction that lowers or raises the travel emissions result.
- Notes. Anything the numbers hide.
You do not need a spreadsheet application. A sheet of paper with a row per group works for a small wedding. A spreadsheet helps once you have more than six or seven groups or want to rerun scenarios quickly.
How to size the groups
Aim for five to eight groups. Fewer and you lump unlike trips together, so a short flight and a long one average out into something that describes neither. More and you are drifting back toward individual tracking, which adds effort without improving the travel emissions result. Natural cut points are:
- Local guests who drive a short distance, perhaps under thirty miles.
- Regional drivers, within a few hours of the venue.
- Regional rail or bus travelers, if there is a viable route.
- Domestic flyers, split into shorter and longer flights if they are clearly different.
- International or very long-haul flyers.
- A separate group for the wedding party or family, if they travel differently or arrive early.
If one group is both large and heterogeneous, split it. If two groups have nearly the same mode and distance, merge them.
Carrying uncertainty forward
The low and high columns are where the travel emissions worksheet earns its trust. For each group, ask which inputs could plausibly be different and by how much, and apply that to the central estimate. You do not need statistics. A rough percentage per group is enough, and it should reflect the labels.
A group made of mostly K inputs, such as a confirmed shuttle with a known route, can carry a narrow band. A group of flyers with an assumed route, an assumed cabin class and an unknown load carries a wide one. Give G-heavy groups the widest bands. A workable convention is roughly a fifth either way for well-known inputs, a third for assumed ones and forty percent or more for guessed ones. These are working conventions to keep you consistent, not scientific findings, and you should state them as such.
Then add the columns. The sum of the lows is your low total and the sum of the highs is your high total. Strictly speaking, independent errors partly cancel, so the true spread is somewhat narrower than the simple sum suggests. Summing is deliberately conservative, and for a travel emissions worksheet this rough, conservative is fine. Say that you summed the bounds.
What the worksheet should print at the bottom
Three numbers and two shares. The three numbers are the low, central and high totals. The two shares are the proportion of the central travel emissions estimate from the largest group, and the proportion that depends on G-labeled inputs. Together they tell the reader what to trust and where the risk lies. A result such as “roughly twelve thousand to twenty-five thousand units, central near nineteen thousand, with the top two groups making up about nine tenths and about a fifth of that resting on guessed inputs” is far more useful than a figure with four significant digits.
A note on units
Pick one unit family and stay with it. Miles with pounds, or kilometers with kilograms. Mixing them within one worksheet is a common source of silent errors, and published factors come in both. If your source uses kilograms per passenger-kilometer and your distances are in miles, convert the distances once, in a labeled step, before multiplying. Write the conversion constant next to the column header so that a reader can check it.
How to choose emission factors for wedding travel emissions
An emission factor is a number that converts an activity, such as one passenger traveling one mile by air, into an amount of greenhouse gas. Choosing factors is the step where a travel emissions worksheet either rests on a credible source or does not. The aim is not to find the one correct factor, since there is none, but to pick a reasonable one from a named publisher, record it, and test how sensitive the result is to the choice.
Where credible factors come from
Several public bodies publish emission factors and calculators. In the United States, the Environmental Protection Agency maintains a greenhouse gas emission factors hub, updated periodically, which lists factors for passenger vehicles, air travel, rail and other transport, with documented assumptions.
The EPA also provides background on the fuel economy of vehicles through the federal fuel economy information site that it shares with the Department of Energy. For flights, the International Civil Aviation Organization offers a carbon emissions calculator that estimates per-passenger emissions for a given route and states its method.
The Greenhouse Gas Protocol, a widely used standard for corporate accounting, publishes guidance on how to treat business travel and passenger transport, which is a useful reference even though a wedding is not a company.
Use these in preference to a blog post, an app with no stated method or a vendor’s marketing page. When you record a factor, write the publisher, the document or tool name and the year or version. If the source gives a range or notes limitations, copy the note into your worksheet.
Matching the factor to the trip
A factor describes an average, and averages hide the specifics of your guests. Ask how well it fits.
For cars, factors are often given per vehicle-mile, which suits a household making one trip, or per passenger-mile based on an assumed average occupancy. Using a per-vehicle factor for a car that carries two people and a per-passenger factor for one carrying a family mixes the two. Pick one basis per group and say which.
For flights, factors usually vary by distance because take-off and landing use more fuel per mile than cruising. A short domestic hop has a higher per-mile factor than a long-haul flight. Factors may also vary by cabin class, because a seat in a premium cabin takes up more of the aircraft. If a guest flies economy, which most do, the economy factor is the better match. If you use a single average, note it.
For rail and bus, factors depend on the system. Electric rail powered by a cleaner grid can have much lower emissions per passenger than diesel rail, and a nearly empty bus can look poor on a per-passenger basis. Where the factor comes from a national average, you are applying that average to a specific line. Treat it as an assumption.
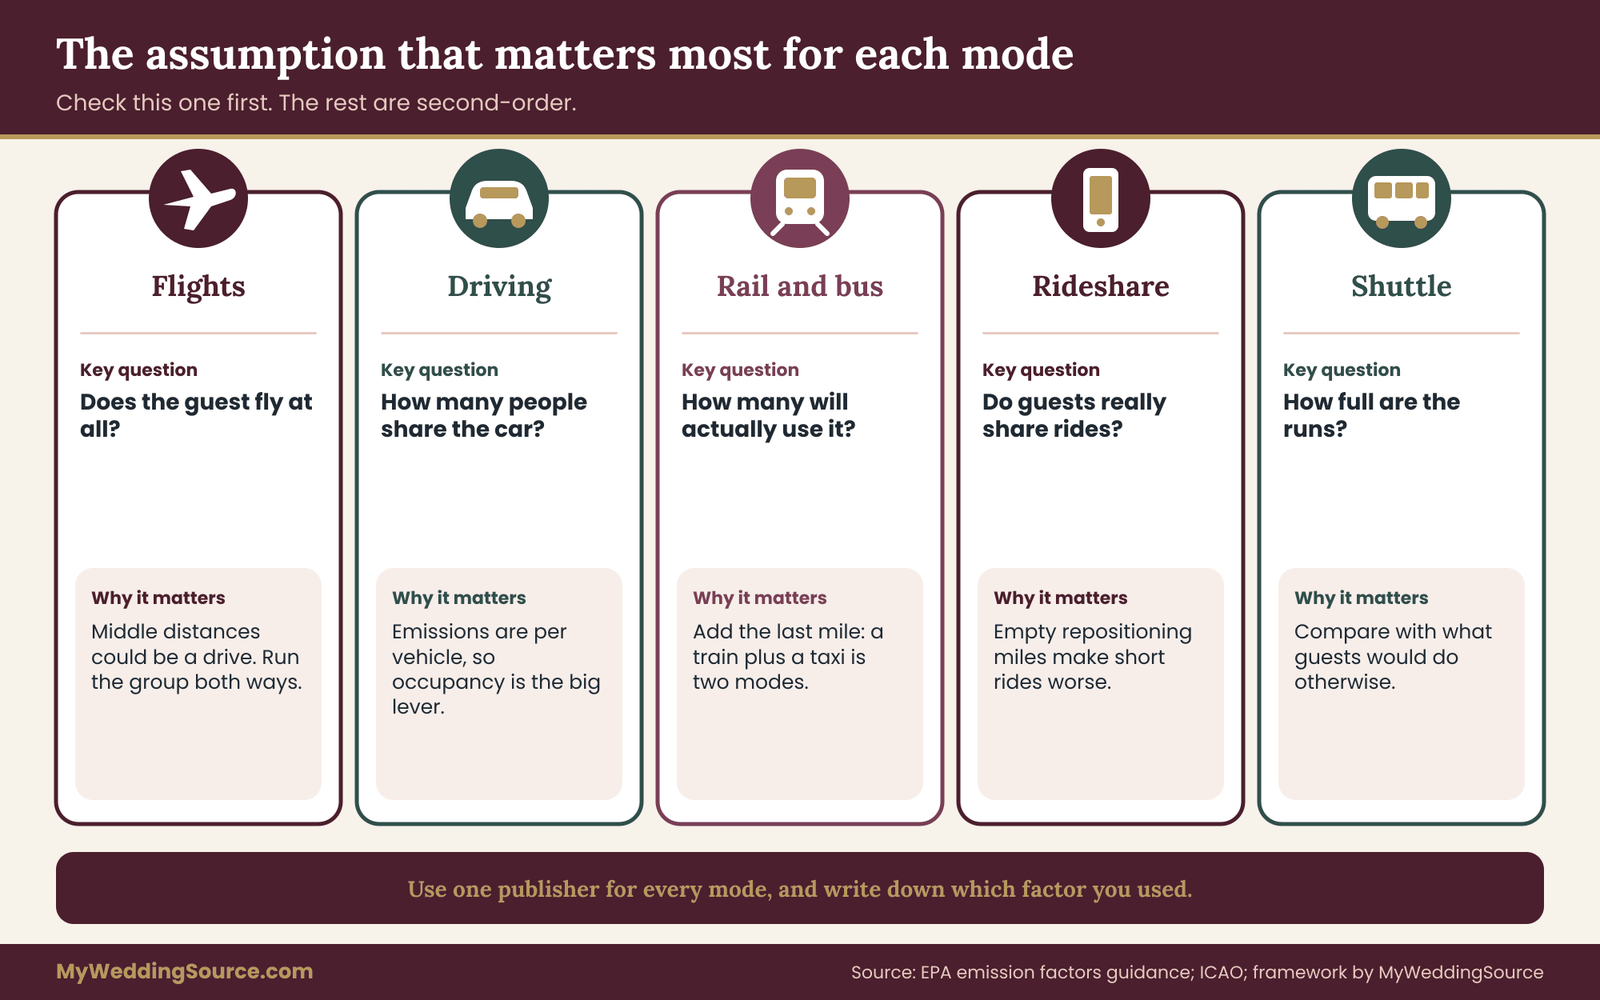
For rideshares and taxis, there is an extra effect that a simple factor misses: the vehicle often drives empty to reach the passenger or after the drop-off. If a rideshare covers short airport transfers, the true figure is higher than the passenger-miles suggest. For a small share of total travel, this does not matter. If the entire guest list uses rideshares from a distant airport, it does.
Test sensitivity instead of searching for perfection
You will often face two plausible factors. Rather than agonize, run the worksheet with each and see how much the travel emissions total moves. If it moves a few percent, pick one and go on. If it moves a third, the factor is a major source of uncertainty and belongs in your low and high columns. Doing this once for the dominant group, usually the flyers, tells you whether further research on factors is worth the time.
Do not mix methods silently
A frequent mistake is to take flight emissions from one calculator, car emissions from another and rail from a third, each with different boundaries and treatment of non-CO2 effects. Then the numbers do not add cleanly. If you must mix, record each source and note that the travel emissions total combines methods. Better, use a single publisher for all modes where you can, so that the same boundaries apply.
Recording the source trail
Add a short “sources” block to your worksheet listing each factor, its publisher, its date and where you found it. If you ever share the result, or if a guest asks how you got it, the trail lets you answer honestly in a minute. It also makes the annual or repeat review easy, since you can check whether a newer version exists.
Mode-by-mode assumptions that move wedding travel emissions
Once the structure is in place, the quality of a travel emissions worksheet depends on a small set of assumptions per mode. This section goes through each mode, the assumption that matters most, and the plain way to label and range it. Treat it as a reference you return to while filling rows.
Flights
Flying usually dominates the travel emissions total, so it deserves the most care and still the least false precision. Four assumptions matter.
Whether the guest flies at all. For guests far away, the default is yes. For guests in a middle band, say three hundred to six hundred miles, the choice between driving and flying depends on cost, time and personal habit, and you cannot know it. Run the group both ways in your low and high columns if the difference is large. A group of ten guests who might fly or drive can swing the travel emissions total noticeably, and recording that fact is more useful than choosing one.
The route. Direct versus connecting flights changes the total distance flown. A connection can add a large detour. You do not know each guest’s routing, so use a great-circle distance between the origin and destination airports and add a modest allowance for indirect routing in the high case. Many published calculators apply such an allowance themselves. Check whether yours does, so you do not apply it twice.
Cabin class and load. An economy seat has a smaller share of the aircraft’s emissions than a business seat, and a full flight has a lower per-passenger figure than a half-empty one. Published factors usually bake in an average load. You cannot do better for individual guests, so label this part A, assumed, and let the travel emissions range reflect it.
One-way versus round trip. Obvious, but a common slip. If the factor or distance is one way, double it for the return. If a guest flies in a different direction home because they continue to another trip, the extra leg is not a wedding leg. Record the assumption.
A final point on flights: whether the travel emissions estimate includes effects beyond carbon dioxide is a methodological choice that changes the figure meaningfully. State which treatment your source uses, and keep the same treatment across all scenarios you compare.
Driving
For drives, the key inputs are distance, vehicle type and occupancy.
Distance. Use the road distance from a mapping tool at the origin band’s center, doubled for the round trip. Add nothing for detours unless you know of a specific one. Label as A, since you do not know each guest’s exact origin.
Vehicle. Average passenger-vehicle factors cover everything from small hybrids to large trucks. If you know a guest drives an electric vehicle, the picture changes, though the emissions then depend on the local electricity grid. You almost never know, so use an average factor and widen the travel emissions range slightly. The federal fuel economy site is a useful reference if you want a sense of how much vehicle type matters.
Occupancy. A car’s emissions are per vehicle, not per person. Two couples carpooling emit about the same as one couple driving alone, on the road, but half as much per person. This is the single biggest lever in driving groups, and it is also one that you can influence by encouraging carpools. Assume a modest number of people per vehicle for each household type, such as two for couples and a different figure for families, and label it as assumed.
Rail and bus
If a convenient intercity train or bus exists between the origin and the venue, some guests will use it, but fewer than the people who say they would. Label the share as A or G. Use a published per-passenger factor for the system if you can find one, or a national average from a reliable source otherwise, and widen the range, because system-specific figures can differ widely from averages. Remember the last mile: a train to the nearest station followed by a taxi to a venue twelve miles away is two modes, not one.
Rideshares, taxis and rentals
Short transfers between an airport and a hotel are a small piece of the total for flyers, but a large number of them can add up when many guests arrive on the same day. A rented car carrying four guests from the airport is often more efficient per person than four separate rideshares, but only if they truly share. Treat these as one extra row, “airport to lodging,” and assume a plausible split between sharing and not sharing. If it turns out to be below a few percent of the total, say so and move on.
The shuttle
A shuttle or charter bus between the hotel block and the venue is the one part of the travel that the couple controls directly. That makes it the best-documented row: you know the vehicle, the route, the number of runs and often the fuel type from the operator. Ask the company for vehicle type, number of round trips and distance, and use that.
A fully loaded coach replaces many car trips and is usually favorable per person, but a half-empty bus running a long loop is not. Compare the shuttle against what guests would do otherwise, which is often a group of rideshares or a few designated drivers, not against nothing.
The guide to guest hotels across budgets and mobility needs explains how hotel blocks and transport choices interact, and its decisions about where guests sleep set the distance that this row covers. If most guests stay at one hotel within walking distance of the venue, the local movement row nearly vanishes.
On-site and walking
If the ceremony and reception share a venue with lodging, local movement drops to almost nothing. Do not spend effort here. Put a single line in the travel emissions worksheet, “walking and on-site, negligible, assumed,” and move on. A worksheet that records what it chose to ignore is more trustworthy than one that pretends to have counted everything.
Children, infants and non-attending partners
Small passengers count. A child in a car seat adds no vehicle-miles, so for a car group they do not change the total. A child with a flight ticket has a per-passenger share like an adult, while a lap infant on an international flight is typically not counted in per-seat factors. These are second-order details. Use the same factor per ticketed passenger and move on.
Two quick checks before you trust a row
Before you accept any row, do two sanity checks. First, ask whether the row’s central estimate seems the right order of magnitude when compared with another row. A row for twenty flyers should dwarf a row for twenty local drivers, and if it does not, you probably made a unit or distance error. Second, ask what single assumption, if wrong, would change the row by half. If you can name it, put it in the notes column and in the low or high case.
Comparing venue and date options with a travel emissions estimate
The strongest use of the travel emissions worksheet is comparison. When you apply the same method to two scenarios, shared errors cancel, and the difference between them tells you more than either absolute figure. This section explains how to do it without fooling yourself.
Keep everything but one thing the same
Build the baseline scenario first. Then change one decision, such as the venue city, and rebuild only the rows it affects. Keep the guest list, the label rules, the factors and the uncertainty conventions identical. If you change two things at once, you cannot say which caused the difference.
Be careful about what moves when the venue moves. A different city changes every group’s distance, and may change the likely mode of some of them. A venue closer to a large cluster of guests can cut a flying group into a driving group, which is a large reduction, while pushing a smaller group from driving to flying, which is a large increase for them. The net effect depends on the sizes of the groups, which is why a labeled worksheet is better than intuition.
Compare ranges, not midpoints
If scenario A has a central estimate of one number and scenario B has one fifteen percent lower, check whether the ranges overlap. When the ranges overlap heavily, which they usually do for small differences, the honest conclusion is that the two options are about the same on this measure, and other considerations such as cost, guest comfort and meaning should decide. When the ranges barely overlap, you have a real difference worth weighing.
A useful rule of thumb is to treat a difference as meaningful only if it exceeds the combined uncertainty you assigned. You set those percentages yourself, so you cannot claim more precision than you put in.
Date effects
Date changes rarely change the distance, but they can change the mode and the number of guests. A holiday weekend may push more guests to fly in for a longer stay, or make flights fuller. A date that conflicts with other events may reduce attendance. The guide on choosing a wedding date covers those trade-offs from the planning side. For the travel emissions worksheet, the useful move is to vary attendance and mode share between scenarios, and see whether the total is sensitive to it.
The distance trap
Comparisons often go wrong when couples focus on the venue’s distance from their own home. Your own commute is rarely the issue. What matters is the distribution of everyone else’s origins. If sixty percent of guests live in one region and you hold the wedding in a different one for personal reasons, the extra travel falls mostly on those guests. That can be a perfectly good decision, but it is worth seeing in the numbers.
What a comparison cannot capture
The worksheet counts emissions, not meaning. A destination wedding may bring a smaller, more committed group, and a hometown wedding may bring a larger one. Fewer guests mean fewer trips but also fewer people celebrating. Because those are values, not arithmetic, keep the comparison as one input among several. The budget guide is a good companion, since travel emissions and travel costs for guests often move together, and you may find that the cheaper option for most guests is also the lower-emission one, or that it is not.
A worked example of a wedding travel emissions worksheet
The example below uses an invented wedding and invented numbers. The emission factors are round placeholders chosen to keep the arithmetic readable. They are not real values, and nobody should copy them. In a real worksheet you would replace each factor with a current figure from a named publisher such as the Environmental Protection Agency. What the example demonstrates is the method: labeled inputs, a low-central-high range, shares, and a sensitivity check.
The invented wedding
A couple is planning a wedding for 110 traveling guests in a mid-sized city. They have a rough guest list with household mailing addresses and a handful of RSVP notes. They decide the boundary is guest round trips from home to the wedding city and back, including airport transfers, and excluding vendors, the honeymoon and the couple’s own travel. They record that boundary in two sentences at the top of the sheet.
They group guests into five rows.
Group A, local drivers. Households within about twenty miles. They expect 24 vehicles, each making a round trip of about 40 miles. Vehicles: K, since the RSVP list shows 24 households. Distance: A, since it comes from address bands. Mode: K.
Group B, regional drivers. Households two to four hours away. They expect 14 vehicles, each making a round trip of about 300 miles. Vehicle count: A, since some of these households might fly or take a train. Distance: A.
Group C, regional rail. Six guests in a city with a direct train line, each traveling about 400 miles round trip. Whether they take the train: G, since the couple merely hopes they will, and some may drive instead.
Group D, domestic flyers. Twenty guests, each flying about 1,800 miles round trip. Head count: A. Mode: A. Route: A.
Group E, long-haul flyers. Six guests, each flying about 5,000 miles round trip. Head count: K, since they replied early. Mode: K. Route: A.
Those five groups cover the 110 guests: 24 vehicles carry about 48 guests, 14 vehicles carry about 30, and the rest are the rail and flying groups.
The placeholder factors and ranges
For the demonstration, the couple uses these invented factors. A car: 0.4 units per vehicle-mile. Rail: 0.1 units per passenger-mile. Flying: 0.25 units per passenger-mile. Units are a stand-in for kilograms of CO2e, so the numbers have a scale without claiming to be real.
They assign uncertainty by label convention. Group A carries about thirty percent either way, because distances were inferred from address bands. Group B carries twenty percent. Group C carries twenty-five percent. Group D carries thirty-five percent, since routes, loads and mode choice are all assumed. Group E carries forty percent, since long routes with connections have more room to vary. The percentages are working conventions the couple chose, and the sheet says so.
The arithmetic
The central estimates are:
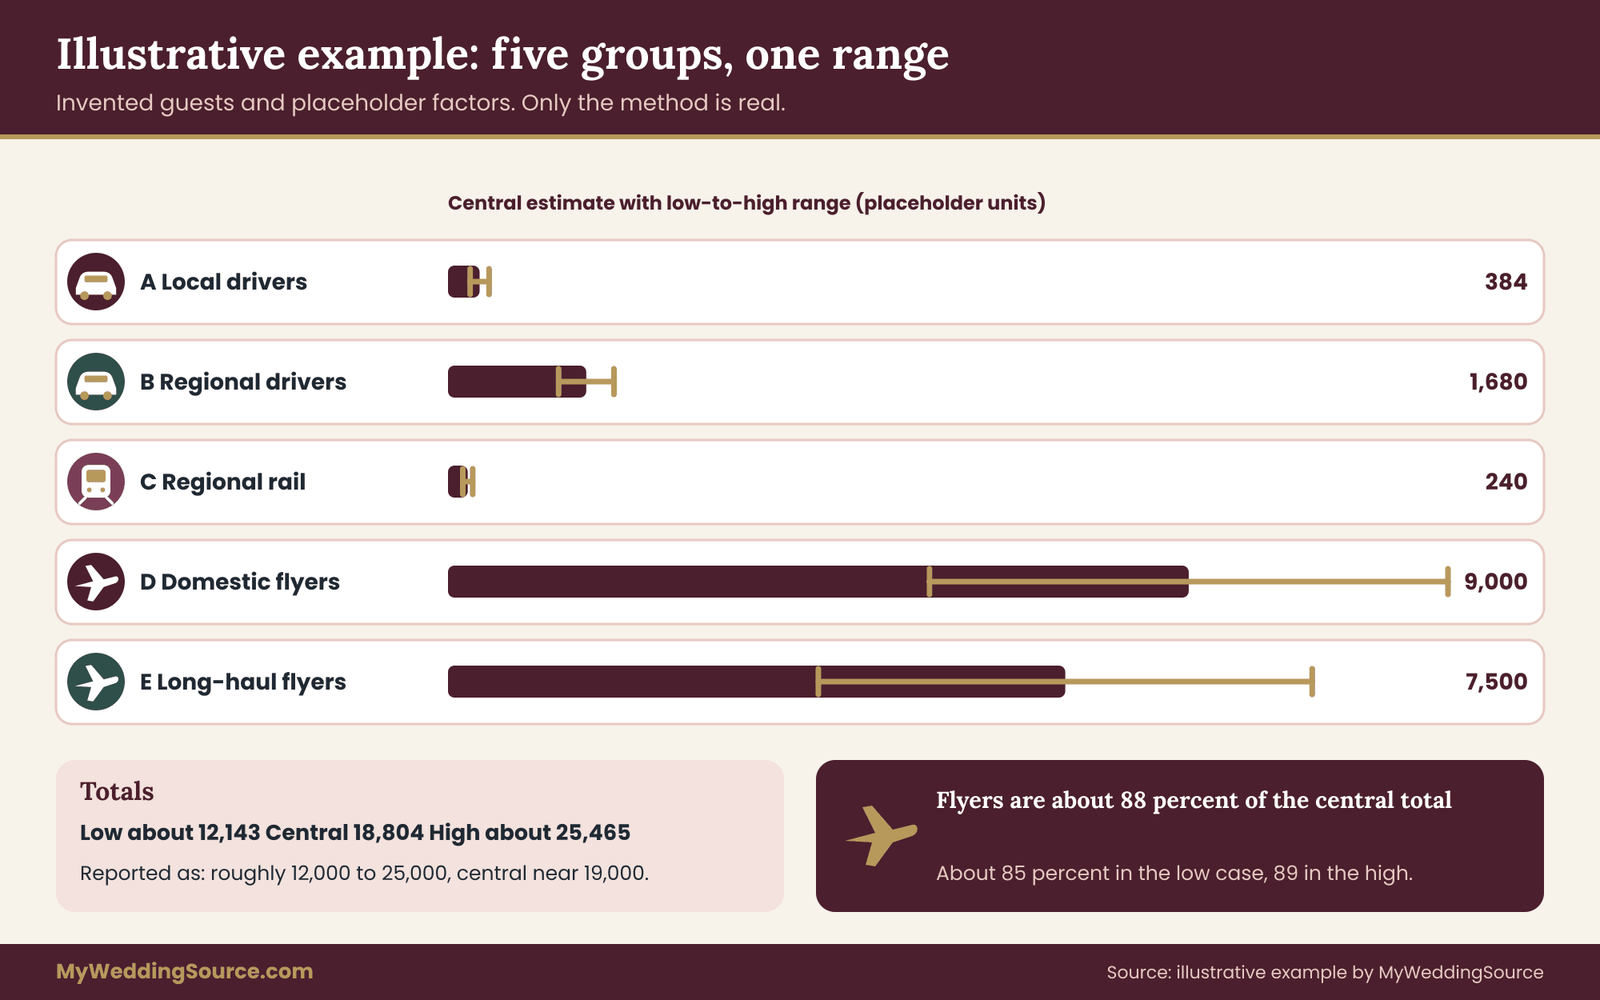
- Group A: 24 vehicles × 40 miles × 0.4 = 384 units.
- Group B: 14 vehicles × 300 miles × 0.4 = 1,680 units.
- Group C: 6 guests × 400 miles × 0.1 = 240 units.
- Group D: 20 guests × 1,800 miles × 0.25 = 9,000 units.
- Group E: 6 guests × 5,000 miles × 0.25 = 7,500 units.
The central total is 18,804 units.
Low case, applying each group’s percentage downward: 269, 1,344, 180, 5,850 and 4,500. The low total is about 12,143 units.
High case, applying each percentage upward: 499, 2,016, 300, 12,150 and 10,500. The high total is about 25,465 units.
So the couple’s honest statement is: “Roughly twelve thousand to twenty-five thousand units, with a central figure near nineteen thousand.” They do not report 18,804 as if the last digit meant something.
Reading the result
Flying groups D and E contribute 16,500 of the 18,804 central units, about 88 percent. In the low case they contribute about 85 percent and in the high case about 89 percent. So the conclusion that flights dominate holds across the whole range, and that is the stable finding. It would remain true even if the factors were wrong by a comfortable margin, as long as they were wrong in the same direction for all modes.
Now the sharing of uncertainty. The largest group by emissions, Group D, is made of A-labeled inputs. The next, Group E, is partly K and partly A. Together they account for most of the spread between low and high. The couple notes that attendance of these twenty-six guests is the factor that matters most, and that the exact factor values matter second.
The couple also computes the share of the central travel emissions estimate resting on G-labeled inputs. Only Group C has a guessed input, and it contributes 240 units, about 1.3 percent. So the guessed rail share barely matters, even though it is the weakest input. That finding frees them from worrying about it.
Sensitivity checks
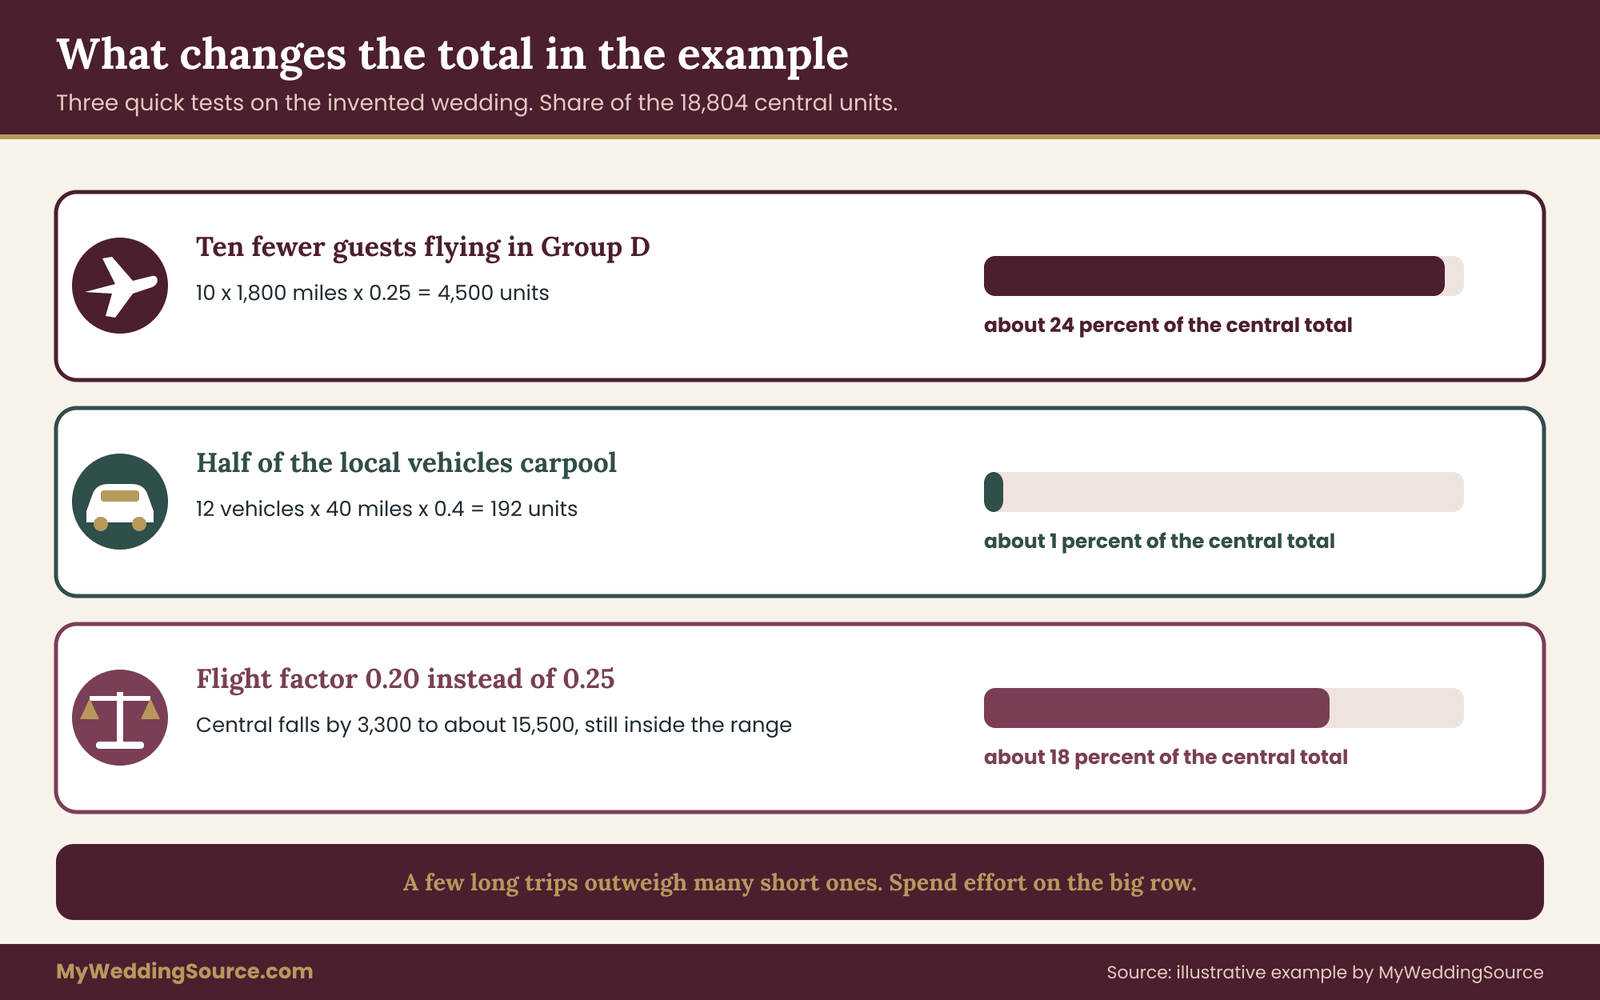
The couple runs two quick what-if tests to see which choices are worth anything.
Ten fewer long-distance flyers. If ten of the 26 flying guests, at an average of the two flying groups’ distances, were not to travel, the central estimate falls by a large amount. Taking ten from Group D alone removes 10 × 1,800 × 0.25 = 4,500 units, about 24 percent of the central total. The couple does not intend to discourage anyone from coming. The point is to see the scale: a few long trips carry more weight than everything else combined.
Twelve vehicles carpool in Group A. If half of the local vehicles combined into shared rides, 12 vehicles × 40 miles × 0.4 = 192 units would be saved, about 1 percent of the central total. Encouraging carpooling for local guests is friendly and harmless, but it is not where the emissions are.
Factor swap. If the flying factor were 0.2 instead of 0.25, the central total would fall by 3,300 units to about 15,500, which still lies inside the original range. The conclusion about dominance holds.
What the couple decides
Based on the range, the couple makes three practical decisions, none of which depend on the exact total. They will not spend time optimizing local carpools. They will ask the long-distance guests, gently and optionally, about their plans, so they can replace guesses with knowns in groups D and E. And they will consider, for any future event such as a follow-up celebration, holding it where the flying group already lives, as a way to give those guests another chance to celebrate without a long trip.
They also decide not to publish a single total. On their wedding website they write a short note giving the range, naming flights as the main source, and listing what is excluded.
What the example does not show
It uses invented factors, so its totals mean nothing outside the arithmetic. It ignores airport transfers and the shuttle, which a fuller worksheet would add as extra rows. It treats all flyers in a group as identical when real guests vary. And it assumes the guest list is final, when real attendance shifts until the last week. None of these omissions is hidden: each appears in the notes column. That habit of listing what you left out is the part of the example most worth copying.
Reusing the worksheet
Once built, the travel emissions worksheet takes minutes to update. When RSVPs change, edit the head counts and rerun. When a new factor version is published, replace the factor and rerun. When you consider an alternative venue, copy the sheet, change the distances and compare. The effort is front-loaded in the first version, which is why it is worth getting the labels and boundary right once.
Turning a travel emissions range into decisions
A range is only useful if it changes what you do, or confirms that you do not need to change anything. This section covers how to read the travel emissions result, which actions follow from it, and which ones are tempting but weak.
Start with the biggest row
Sort the rows by their share of the central travel emissions estimate. In nearly every wedding with out-of-town guests, one or two rows account for most of the travel emissions total. Those rows are the only ones where a decision can move the travel emissions result by a meaningful amount. Everything else is housekeeping.
Then ask of each big row: is the driver the number of people, the distance, or the mode? A row of flyers driven by head count responds to guest list decisions. A row driven by distance responds to location decisions. A row driven by mode, such as a middle band that could drive or fly, responds to nudges and logistics. Different drivers call for different tools, and mixing them up wastes effort.
Decisions that actually move the total
Location relative to the guest cluster. The most powerful lever is where the wedding happens compared with where guests live. A site closer to the largest group of long-distance guests can reduce the dominant row substantially, at the cost of lengthening shorter trips for others. Only the travel emissions worksheet can tell you the net. If you are still choosing a venue, run the comparison before you sign. The venue planning guide covers the practical side of choosing a place, and travel distribution is one more criterion alongside capacity, price and access.
Guest count and who is invited. Inviting fewer long-distance guests reduces the travel emissions total, but this is also the most personal lever. Many couples decide that the people who will fly in are exactly the people they most want present. That is a legitimate answer, and the travel emissions worksheet’s role is to make the trade visible, not to settle it.
Combining the trip with other occasions. Guests who would visit the region anyway, or who combine the wedding with a family reunion, make fewer separate trips. A weekend that gives people a reason to stay longer, but not a reason to take a second trip, tends to be efficient per day of celebration. This is hard to engineer, and easy to overclaim.
Hotel and venue proximity. Putting lodging and the venue close together removes local movement and the need for a shuttle. It also reduces the chance of late-night driving after the reception. This often improves both emissions and safety.
Shuttle design. A shuttle with full runs at sensible times beats many cars. A shuttle that runs half empty on a long loop may not. Ask the operator about vehicle type and compare to the likely alternative.
Decisions that matter less than they seem
Local carpool campaigns, as the worked example showed, usually save little because local guests make short trips. Printing fewer paper items or shipping fewer gifts may be worthwhile on other grounds, but they do not touch travel. Encouraging guests to bike from a nearby hotel is pleasant, and it adds almost nothing to the total.
None of this means small actions are worthless. It means that if you want to reduce travel emissions meaningfully, the effort belongs on the large rows, and effort on small rows should be justified by other reasons, such as cost, convenience or goodwill.
Offsets and contributions
Some couples consider paying for an offset or contributing to a climate project to balance the travel emissions estimate. This is a personal choice, and it carries a particular honesty problem. An estimate with a wide range cannot justify a claim that the wedding is “carbon neutral” or “carbon free.” The Federal Trade Commission’s Green Guides caution marketers against general environmental benefit claims and against unqualified offset claims, and they say that offset claims should be supported and should not be misleading about timing or whether the reduction would have happened anyway.
A private couple is not subject to those guides as a marketer is, but the reasoning is sound for anyone making a public statement.
If you do choose to contribute, a few habits keep it honest. Decide the amount from the high end of your range rather than the central figure, since a larger estimate is the safer assumption. Describe it as a contribution, not as cancelling the emissions. Name what you funded, and check the provider’s own claims against what the provider can substantiate. And do not describe the wedding as having “no impact.” The more modest “we estimated and contributed toward” is accurate and fits what you know.
Talking about it with guests
Whether and how to share the travel emissions estimate is a matter of tone. A short note on the wedding website works well, and it should do three things: give the range, name the main source, and say what you excluded. For example, a sentence along the lines of “We estimated guest travel at a broad range, mostly from flights, and we know that estimate is rough” is accurate and brief. Avoid language that makes guests feel judged for traveling.
Avoid asking guests to offset their own flights as a condition of coming. Avoid ranking guests by distance. And avoid framing long-distance travel as a failing, since most people who travel far do so out of love, obligation or both. If a guest brings it up, thank them for coming and leave it there.
Sharing your method
If you want to share more, share the method rather than only the result. A short paragraph describing the groups, the labels and the factor source lets other couples build their own, and lets a skeptical reader see what you did. This is the opposite of a polished badge on a website, and it is more credible for that reason.
Revisit when facts change
Run the travel emissions worksheet at three points. Early, when you are choosing the venue and date, to compare options. Mid-way, after RSVPs, to replace guesses with plans. And afterwards, if you want, to record what actually happened. The final version is the only one that deserves any claim to being “what happened,” and even it is an travel emissions estimate, since you will not know every guest’s actual route.
The wedding waste reduction guide uses a similar idea for catering and cleanup: measure roughly, find the big items and avoid claims you cannot support. Travel and waste are separate worksheets, and combining them into one number would add confusion without insight. Keep them side by side and compare them only by their largest sources.
A decision rule you can write on one card
If you want a short rule to carry through planning, use this one. Find the largest row. If it is flights, the decision that matters is who flies and from where. Decide that consciously, with the people involved where possible. Then do the inexpensive things for the small rows because they are easy, not because they change the picture. Report a range. Name your exclusions. Revisit the travel emissions worksheet when RSVPs close.

Limitations and edge cases in wedding travel emissions estimates
Every estimate has limits, and stating them is part of the method. This section lists the limits that matter most for a wedding, plus several awkward cases that come up in practice.
What the worksheet cannot know
It cannot know exactly who attends. It cannot know each guest’s route, vehicle, cabin class or load factor. It cannot know whether a guest’s trip would have happened anyway. It cannot capture the full climate effect of aviation with certainty, because the science on non-CO2 effects carries its own uncertainty and calculators treat it differently. And it cannot tell you whether the wedding is “worth” its emissions, since that is a value judgment.
It also cannot compare itself to other weddings. Two couples using different boundaries, factors and label conventions produce numbers that are not comparable, even if both are honest. If you see a claim such as “our wedding was lower than average,” ask what boundary and what average, and expect that nobody can answer.
Awkward cases
A guest who combines the wedding with business travel. The flight has two purposes. Counting all of it overstates the wedding’s share, while counting none understates it. A reasonable simplification is to count it in full and note the simplification, or to count half, whichever you state. Do not agonize, because the effect is usually small relative to the dominant row.
A guest who drives a long way instead of flying. A guest who drives a long way alone may emit more per person than a flyer, depending on the vehicle and occupancy. Do not assume that driving is always better. Use the factors.
A guest who takes a train and then needs a long ride. Treat as two segments with two factors, and watch for double counting if the guest’s ride ends at a hotel that is also counted in the shuttle row.
Cruise, ferry or overnight trips. If any part of a guest’s journey is by sea, find a published factor for that mode and assign a wide range. If it applies to one or two guests, give it a note and skip the precision.
Destination weddings. When most guests must fly, the flying rows dominate by a wide margin. The travel emissions worksheet is simpler, not harder, because a few rows hold nearly everything. The honest statement is usually that travel is the main source, and the useful comparison is against a home-region option.
Elopements and tiny weddings. If six people attend, the whole exercise can be two rows. A single paragraph of notes may be enough. Do not build a machine to measure a handful of trips.
Second events. A rehearsal dinner in another city, a family gathering abroad or a post-wedding trip is a separate worksheet or a labeled additional block, not a reason to stretch the boundary mid-way.
Guests who cancel or arrive late. Late changes alter the travel emissions total, but the range should already cover it. Do not rerun the whole thing for a single cancellation unless the cancellation involves a large long-distance group.
Mistakes to catch before you share anything
A short list of errors shows up in almost every first worksheet. Mixing miles and kilometers. Using a one-way distance with a round-trip factor. Counting a car’s emissions per passenger, then multiplying by a head count that already includes everyone in the car. Applying a per-passenger flying factor to a vehicle count. Forgetting that the factor already includes a load assumption. Summing rows that use different boundaries. Reporting more digits than the inputs support. Check each one, and write down the check.
When an estimate is not worth building
If nothing you learn could change a decision, you may not need the travel emissions worksheet. If the wedding is small, local and already booked, the main finding will be that travel is a small piece, and a few lines will do. If the main reason for the travel emissions estimate is a wish to publish an impressive-sounding figure, consider whether the figure helps anyone. Honest effort is best spent where a decision remains open.
Keeping the claim modest
When you describe the travel emissions result, match the claim to the evidence. “We estimated” is better than “we measured.” “Roughly” is better than “exactly.” “Mostly flights” is better than a percentage you cannot defend. And “we left out” belongs in the same sentence as the travel emissions result, not in a footnote. This modesty is not a weakness. It is what lets a reader believe the rest.
Review and updating
Factors and tools change. Agencies revise emission factors, and calculators update their methods. If you keep the travel emissions worksheet for future use, note the date and the version of each factor, and check for newer ones before reusing it. If you are advising a friend or a community group, the same rule applies: tell them to check the publisher’s current figures, not to copy yours.
If you want an outside view, a sustainability professional who works with event or travel accounting can review a travel emissions worksheet for method problems. Ask them what they would change, not whether the number is right, because the second question has no clean answer.
Your next steps
Spend one evening on the first pass. Write the two-sentence boundary. Sort your guests into five to eight groups using distance bands from your existing list. Label each input K, A or G. Pick one publisher for your emission factors, write down the name and year, and fill in a central estimate for each row. Then add the low and high columns using the percentages you chose, and print the three totals and the two shares.
Next, look at the largest row and ask which decision would change it. If it is something you can still decide, such as the venue, run the comparison before you commit. If it is not, accept the figure, note it, and spend your effort elsewhere. When RSVPs close, replace guesses with plans where you can.
Whatever you decide to say publicly, keep it a range, name what you left out, and send readers to the sources below for current factors. Your wedding guest travel emissions estimate does not have to be exact to be useful. It has to be honest about how rough it is.
FAQ
How accurate can a wedding guest travel emissions estimate be?
Not very, and that is acceptable. Attendance, routes, vehicles, cabin class and occupancy are all uncertain, so a realistic result is a range, sometimes spanning a factor of two. What you can usually do reliably is identify the dominant source, such as flights, and compare two options using the same method. Report the range, not a single figure, and say what you excluded.
Which emission factors should I use for guest travel?
Use factors from a named public source and record the publisher and year. In the United States, the Environmental Protection Agency’s emission factors hub covers cars, rail and air travel, and the International Civil Aviation Organization offers a flight calculator. Avoid unlabeled figures from apps or blogs. Use one publisher for all modes where possible, and check for newer versions before you reuse a travel emissions worksheet.
Do I count the couple, the wedding party and the vendors?
Choose and state it. Many couples count everyone who travels because of the wedding, including themselves and the wedding party, and mention that vendors are excluded. If vendors travel a long way, as in a destination wedding with a hired team, consider a separate row. What matters is consistency across scenarios, so a comparison between venues uses the same boundary for both.
How do I ask guests about their travel without being intrusive?
Make one optional question on the RSVP or website, ask only for a rough idea of how they plan to arrive, and say that skipping it is fine. Do not ask for flight details or exact addresses. Group guests by distance band and delete detailed data once grouped. Never rank or comment on individual guests’ choices, since many travel far for good reasons.
Should we buy carbon offsets for our wedding?
That is a personal decision, and a travel emissions estimate cannot make an offset claim true. If you contribute, base the amount on the high end of your range, call it a contribution instead of cancellation, and name what you funded. The Federal Trade Commission’s Green Guides warn marketers against unsupported offset and general environmental claims, and the same caution is good practice for any public statement.
Does flying always cause more emissions than driving?
No. Per passenger-mile, a full car or a full train can be lower than a flight, but a person driving alone in a large vehicle can emit more than an economy air passenger over a comparable distance. Distance, vehicle type, occupancy and load all matter. Use published factors for your actual groups instead of assuming, and test the result against low and high cases.
Is it worth estimating if the wedding is small and local?
Usually only briefly. If most guests live within a short drive, the travel emissions estimate will show that travel is small, and a few lines will do. The effort pays off when a decision is still open, such as choosing between venues in different cities, or when a large group will fly in. If no decision can change, treat the travel emissions estimate as curiosity.
How should we describe the result to guests?
Briefly and modestly. Give the range, name the main source, mention what you left out and avoid language that makes long-distance guests feel at fault. A sentence like “we estimated the travel emissions roughly, mostly from flights, and know it is approximate” is accurate. Do not call the wedding carbon neutral, and do not claim a precise total.
Sources
- Greenhouse Gas Emission Factors Hub, U.S. Environmental Protection Agency
- Sustainable Management of Materials, U.S. Environmental Protection Agency
- Greenhouse Gas Equivalencies Calculator, U.S. Environmental Protection Agency
- Guides for the Use of Environmental Marketing Claims (Green Guides), Federal Trade Commission
- Carbon Emissions Calculator, International Civil Aviation Organization
- Greenhouse Gas Protocol standards and guidance, World Resources Institute and WBCSD
- Fuel Economy information, U.S. Department of Energy and EPA
- Bureau of Transportation Statistics, U.S. Department of Transportation
- Climate change indicators, U.S. Environmental Protection Agency