

The average wedding cost you see quoted online describes what couples paid in 2025, priced under 2023 and 2024 contracts, not what you will pay for your 2027 wedding budget. Our model projects the real 2027 wedding budget average at $37,281, and the budget most couples actually set for it is closer to $31,057, a gap of $6,224 that opens up quietly, one reasonable decision at a time. Understanding the 2027 wedding budget is crucial for effective planning.
We built this report to show exactly where that gap comes from: which categories are inflating twice as fast as the rest, why cutting your guest list saves less than the math suggests, and which vendors couples protect until there is nothing left to cut. If you read nothing else before you sign a single contract, read the next section.
This report emphasizes the importance of accurately planning your 2027 wedding budget to mitigate unforeseen costs. Many couples find that refining their 2027 wedding budget helps them stay on track financially.
When determining your 2027 wedding budget, consider all potential costs to avoid surprises.
As you plan your 2027 wedding budget, remember to include all potential expenses to avoid last-minute surprises.
If you are planning a 2027 wedding budget, you have probably already seen a national average quoted somewhere. It is a useful number for a headline and almost useless as a planning tool, because it tells you what other couples finished at, not what they started at. The more important question is the one almost no published study answers directly: how far apart are the budget a couple sets and the amount that couple actually pays for their 2027 wedding budget? Understanding the gap in your 2027 wedding budget is essential.
Accurate planning for your 2027 wedding budget requires understanding the true costs involved beyond initial estimates.
Your 2027 wedding budget should factor in all potential costs, including hidden ones, to create a realistic financial plan.
This report is our attempt to answer that. We modeled the 2027 wedding market from the ground up, using published cost data from the largest available industry studies, category-level inflation from federal price data, and card-spending trends from bank transaction analysis. Then we built the part nobody publishes: a projection of what couples will budget, what they will spend, and where the difference comes from.
To better understand your 2027 wedding budget, review this report carefully and consider the factors that contribute to costs.
For a successful 2027 wedding budget, focus on the most significant expense categories that can impact your overall spending. Properly planning your 2027 wedding budget increases your chances of staying within financial limits.
The short version is that the gap is large and predictable. Our model projects the average U.S. wedding at $37,281 in 2027, while the average couple planning one will set a budget closer to $31,057. That is a difference of about $6,224, or roughly 20% above plan, and it lands almost entirely in the final four months of planning when contracts are already signed and options are limited.
During the planning process, keeping your 2027 wedding budget in mind will help you make informed decisions.
The reason this matters is not that couples are careless. It is that the way wedding pricing is presented makes accurate budgeting genuinely difficult. Vendor quotes exclude service charges. Category averages are published as averages among buyers rather than averages across all couples, which makes some line items look larger than they are and others smaller. Guest-count savings are advertised as though every cost scales with the head count, when roughly $6,700 of a typical wedding does not move at all. And a meaningful share of the total, the money guests spend to attend, never appears in any budget document.
It’s important to understand how to allocate your 2027 wedding budget effectively to cover both expected and unexpected costs.
For 2027 wedding budget planning, be mindful of hidden costs that can arise unexpectedly throughout the process. A well-informed 2027 wedding budget includes these considerations.
In this report you will find the projected 2027 average and the range around it, a full category-by-category breakdown with the inflation rate behind each line, the math on what cutting guests actually saves, a ranked index of which vendors couples protect and which they cut first, generational differences between Gen Z and Millennial couples, and the specific budgeting practices that close the gap. Every figure is labeled either as a published finding with its source or as an output of our own model with its assumptions stated. You should be able to disagree with our assumptions and still use the structure.
When assessing your 2027 wedding budget, recognize the potential variations based on location and service preferences.

Every detail of your 2027 wedding budget counts, from vendor selections to guest accommodations.
What This Report Found
Ultimately, understanding your 2027 wedding budget will help you create a memorable event without financial strain.
Twelve findings, stated plainly, before any of the detail.
With careful planning, your 2027 wedding budget can reflect your vision while staying financially responsible.
1. The average 2027 wedding budget in the U.S. is projected to cost $37,281. The plausible range runs from $35,338 to $39,285, depending mainly on how import tariffs on flowers and apparel resolve and how guest counts move.
As you navigate your 2027 wedding budget, remember to communicate openly with partners and family to align on expectations.
2. The average budget couples set for that wedding is projected at $31,057. The gap is $6,224.
Being proactive about your 2027 wedding budget will lead to a more fulfilling and less stressful planning experience.
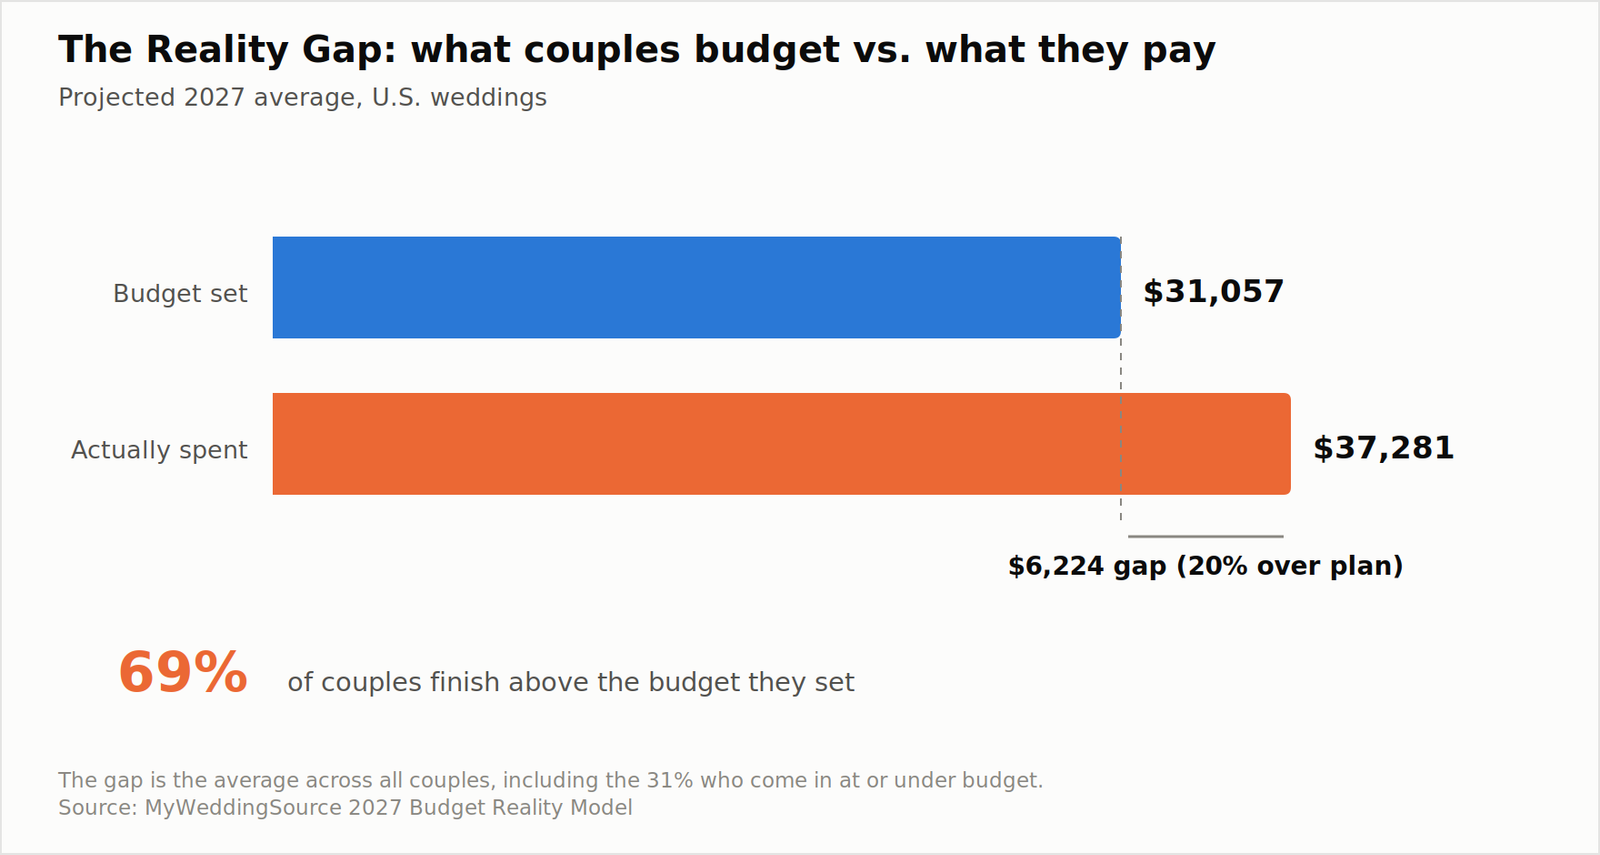
3. About 69% of couples finish above the budget they set. Roughly 11% finish more than 50% above it, and about 5% end up spending at least double their original number.
When planning your 2027 wedding budget, consider utilizing resources and support to streamline the process.
Understanding the typical 2027 wedding budget can help couples set realistic expectations and avoid overspending. Knowledge of your 2027 wedding budget shapes your financial decisions.
4. Couples systematically under-report their own overruns after the fact. Post-wedding surveys find about 32% saying they went over budget. Surveys that check the budget at the start and the total at the end find about 69%. The difference is not dishonesty. It is that budgets get quietly revised upward mid-planning, and the revised number becomes the remembered number.
Researching the elements that contribute to your 2027 wedding budget will help you prepare for financial negotiations with vendors.
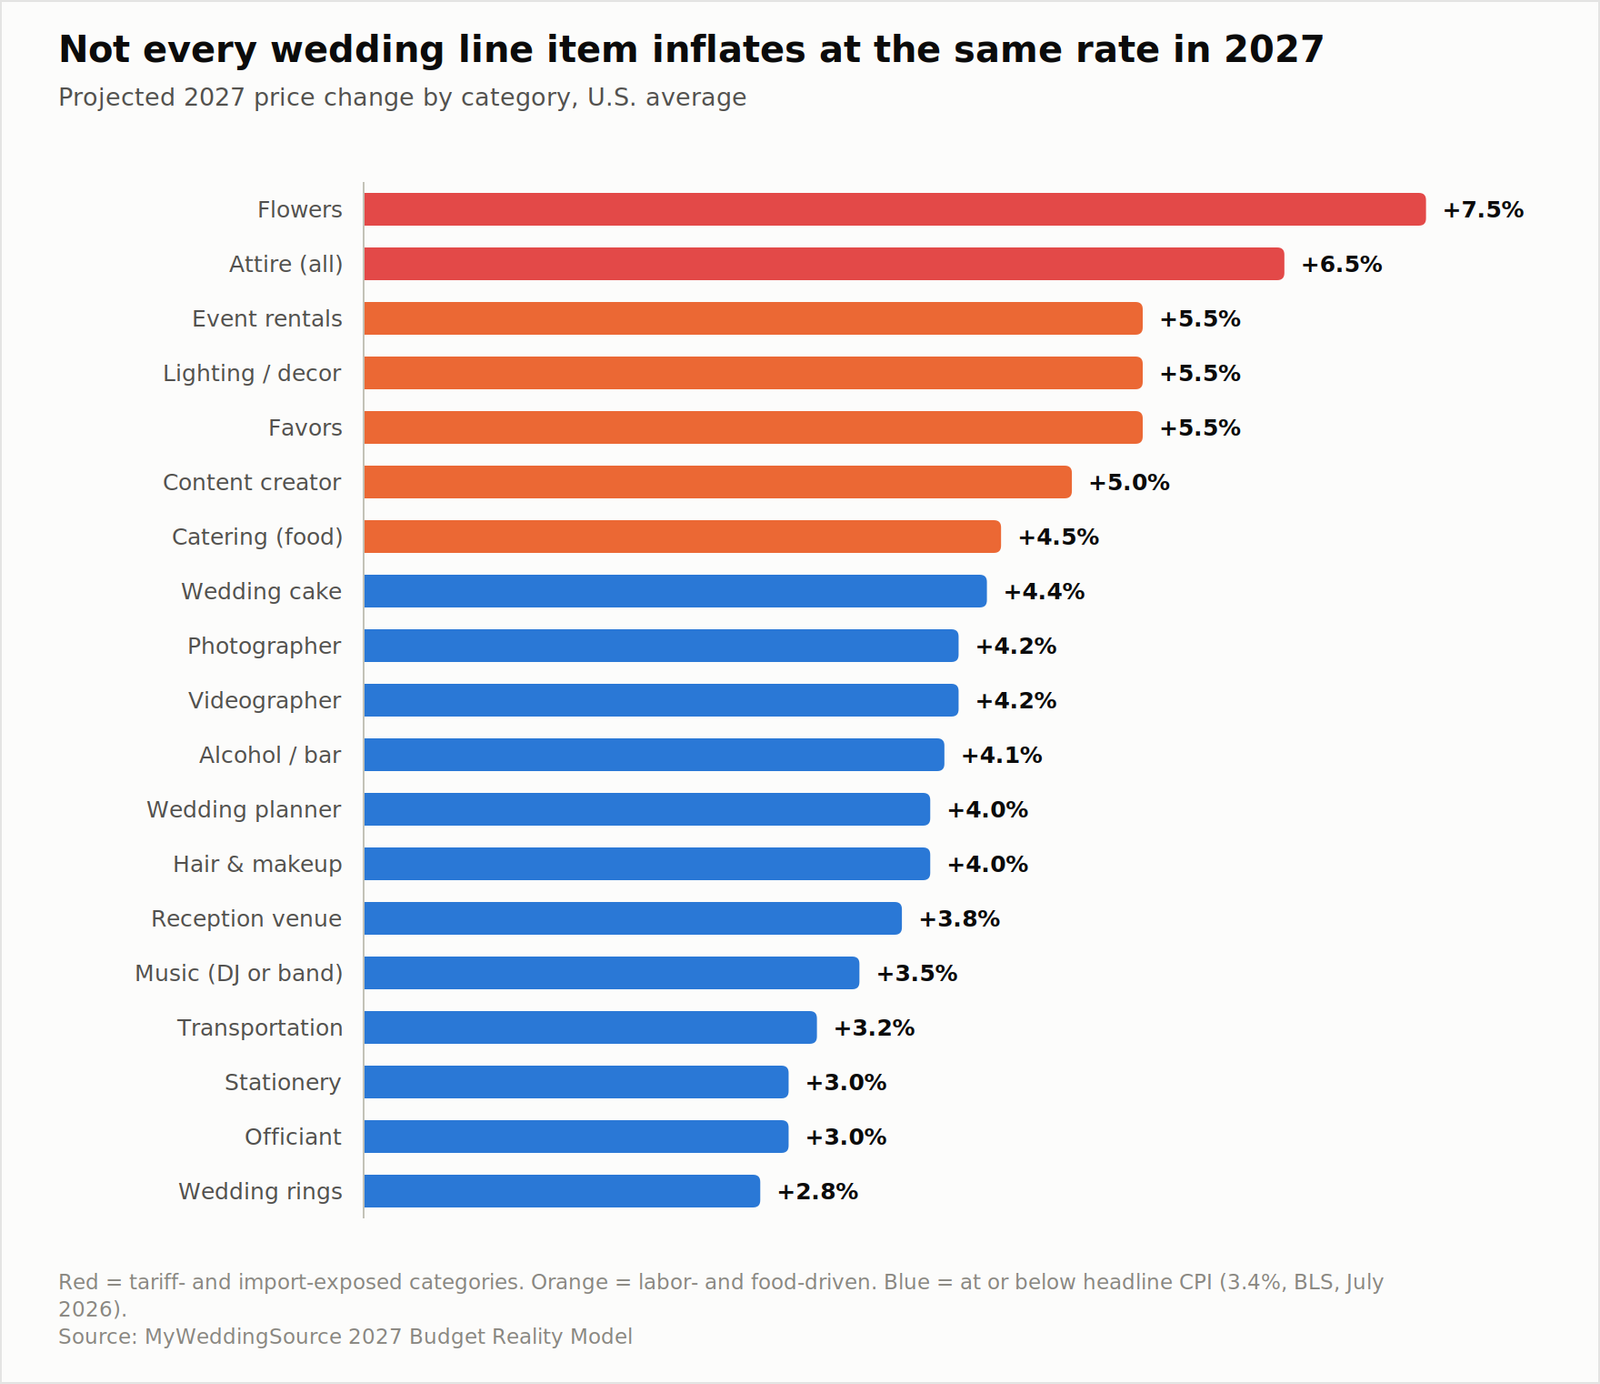
5. Not every line item inflates at the same rate. We project flowers at +7.5% and attire at +6.5% for 2027, against a headline consumer inflation rate of 3.4%. Wedding rings, by contrast, inflate at about +2.8% because lab-grown stones are pulling average ring prices down even as gold prices rise.
Planning your 2027 wedding budget requires clarity around costs associated with each vendor and service.
6. About $6,668 of the average 2027 wedding does not shrink when the guest list does. That is roughly 17.9% of the total, and it is why small weddings cost more per guest, not less.
A thorough examination of your 2027 wedding budget will enhance your ability to make sound financial decisions.
7. Cutting 20 guests from a 117-guest wedding saves about $5,233, not the $6,373 a simple per-guest calculation suggests. The difference, about $1,140, is the fixed floor refusing to move.
As you consider your 2027 wedding budget, involve your partner in discussions about priorities and expectations.
8. Couples cut in a consistent order. Favors, transportation, lighting, and stationery go first. Venue, photography, and food are protected until almost nothing else is left. We ranked all 17 categories on a Cut Resistance Index.
When working through your 2027 wedding budget, ensure you account for both fixed and variable costs in your planning.
9. A wedding funded mostly by parents costs about 55% more than one the couple funds entirely. In 2027 terms, that is roughly $43,167 versus $27,797.
Building your 2027 wedding budget with a clear outline of expected expenses will prevent overspending.
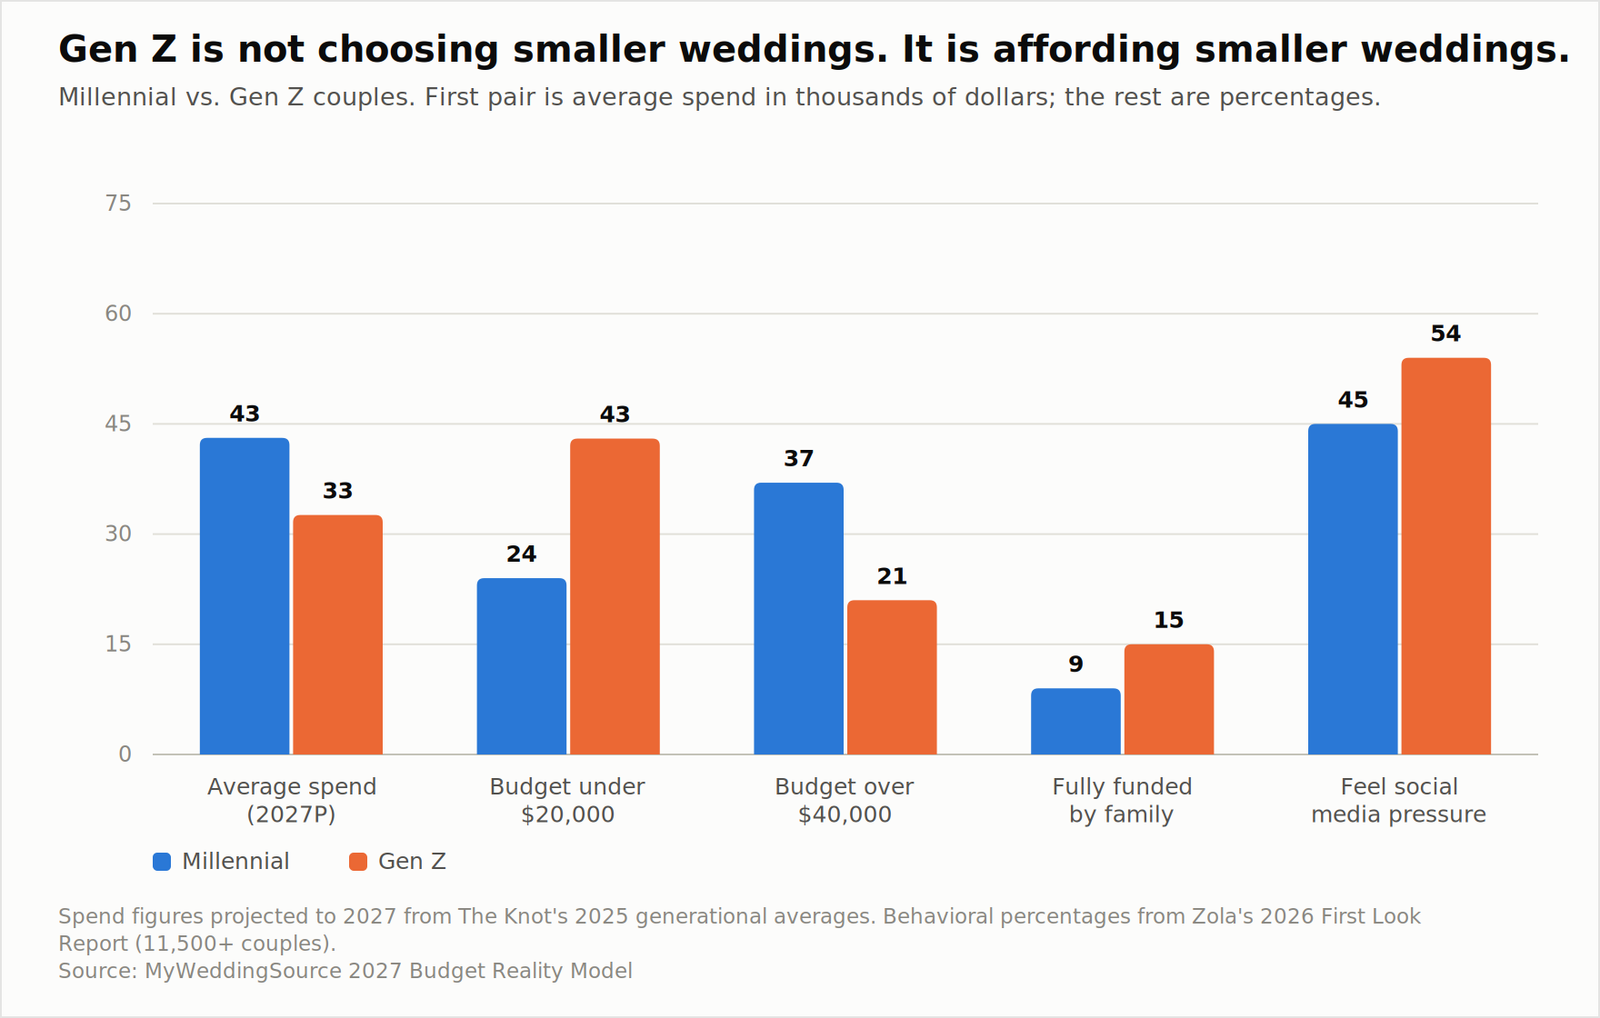
10. Gen Z is not choosing smaller weddings. It is affording smaller weddings. Gen Z couples are projected to spend about $32,703 against $43,167 for Millennial couples, and 43% of Gen Z couples plan under $20,000 against 24% of Millennials.
Engaging with your 2027 wedding budget actively will lead to a more enjoyable wedding experience.
In understanding your 2027 wedding budget, it’s important to factor in how guest contributions can impact overall costs.
Your 2027 wedding budget serves as a roadmap to guide your financial decisions throughout the planning process.
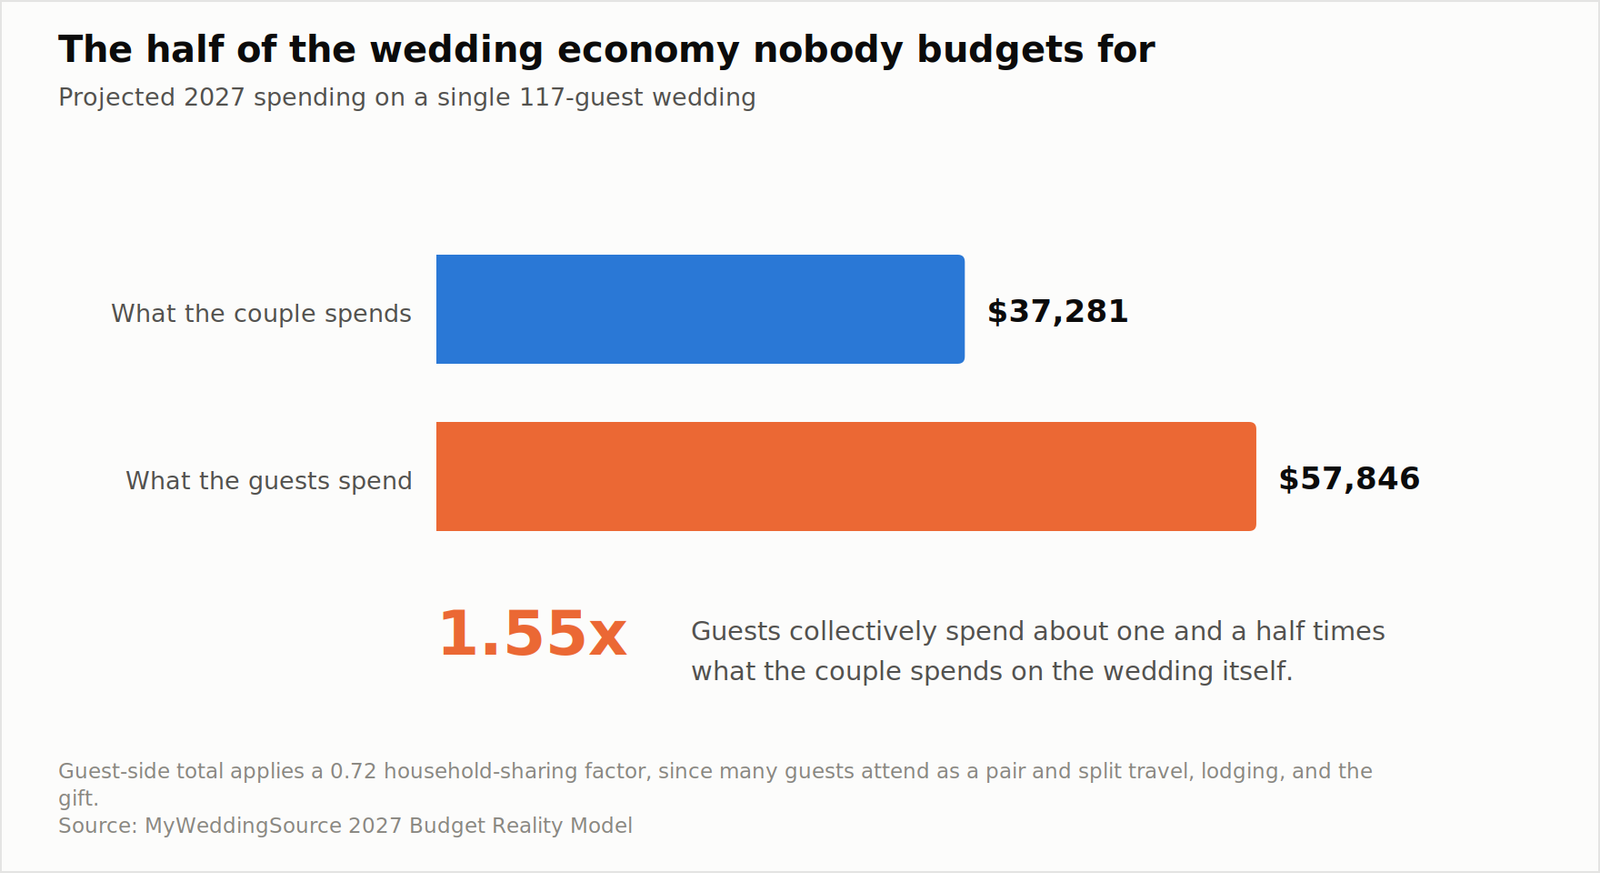
11. Guests collectively spend about 1.55 times what the couple spends. For a 117-guest wedding, that is roughly $57,846 of guest-side cost against $37,281 of couple-side cost, and none of it appears in the couple’s budget.
Prioritize communication about your 2027 wedding budget with vendors to ensure clarity and alignment.
12. AI adoption in wedding planning is rising fast and has not reduced average spend. We project roughly 60% to 71% of couples using AI in some form by 2027, depending on how the question is worded, over a period in which wedding spending grew 8.5% year over year.
Reflecting on your 2027 wedding budget will help maintain focus on the vision you have for your celebration.
Methodology: How We Built the 2027 Numbers
Consider how personal values influence your 2027 wedding budget and spending decisions.
The 2027 wedding budget considerations include recognizing regional differences that can influence costs significantly.
Utilizing resources wisely can support your 2027 wedding budget goals effectively.
You should know how a projection was made before you decide whether to trust it. This section is the whole method, including the parts that are judgment calls.
A comprehensive grasp of your 2027 wedding budget will lead to a more satisfying wedding experience.
The sources we started from
Your 2027 wedding budget should reflect your unique vision while being grounded in financial reality.
Our base layer is published, citable data on what U.S. couples actually spent.
Think strategically about your 2027 wedding budget to enable a joyful celebration.
The Knot’s 2026 Real Weddings Study surveyed 10,474 U.S. couples married in 2025 and put the average wedding at $34,200, with an average guest count of 117, an average spend per guest of $292, and an average of 13 vendors hired. Zola’s 2026 First Look Report surveyed more than 11,500 couples and reported an average of $36,000 with a higher average guest count of 145. The two numbers differ because the two samples and question sets differ, and we use both as bounds rather than picking a winner.
Effective planning around your 2027 wedding budget will contribute to a memorable event.
The Bank of America Institute’s June 2026 analysis of card and ACH transaction data found wedding-related spending up 8.5% year over year through May 2026, which is more than double the growth rate of the two prior years. That figure measures total market spending, not spending per wedding, so it includes volume growth. It is useful as a directional signal on price pressure, not as a per-wedding inflation rate, and we treat it that way.
As you finalize details, keep your 2027 wedding budget visible to guide your decisions.
For category-level price movement we used the Bureau of Labor Statistics Consumer Price Index for July 2026: all items up 3.4% over twelve months, food away from home up 3.4%, apparel up 3.9%, services less energy services up 3.0%, and airline fares up 25.5%.
Stay committed to your 2027 wedding budget throughout the planning phase to ensure success.
For financing behavior we used LendingTree’s survey of 1,050 U.S. newlyweds conducted in March 2025, and Zola’s 2026 funding-source data. For guest-side costs we used The Knot’s guest study of 1,000 U.S. adults who attended weddings in 2024, and a July 2024 survey of 1,024 Americans on declined invitations.
By adhering to your 2027 wedding budget, you can maximize your investment for a beautiful event.
The category basket
Integrate your 2027 wedding budget into every conversation with vendors for clarity.
We built a reference 117-guest wedding as 19 line items. Each line has three inputs: the average spend among couples who buy that category, the share of couples who buy it, and a projected annual inflation rate.
Maintaining a focus on your 2027 wedding budget will empower you to create the event of your dreams.
To accurately plan for a 2027 wedding budget, couples should consider all necessary elements and expenses that might arise.
Ultimately, a clear understanding of your 2027 wedding budget will lead to a more fun and fulfilling experience.
The first input is published. The second is published for three categories only, venue at 89%, photographer at 88%, and caterer at 85%, and modeled for the rest. The third is ours.
Evaluate options through the lens of your 2027 wedding budget to ensure they align with your vision.
We multiply average spend by participation rate to get each category’s effective contribution to the national average, then scale the whole basket so it reproduces the published $34,200 for 2025. The scaling factor is 0.853, which tells you something useful on its own: the published category averages, if you simply added them up, would describe a wedding about 17% more expensive than the average wedding actually is. That is the buyers-versus-everyone distinction, and we come back to it later because it is one of the most common sources of budgeting error.
Your 2027 wedding budget should serve as a living document throughout your planning process.
We then grow each line at its own rate for two years to reach 2027.
Be proactive in managing your 2027 wedding budget to enhance your overall experience.
Where the inflation rates come from
With preparation, your 2027 wedding budget can lead to a successful celebration.
Each category rate is anchored to a federal price series and adjusted for exposures that series does not capture.
Emphasize the importance of your 2027 wedding budget from the outset for effective planning.
Flowers get the highest rate in our model at 7.5%, because roughly 80% of cut flowers sold in the United States are imported and the category has direct tariff exposure that general CPI does not reflect. Attire gets 6.5%, apparel CPI plus bridal-specific import exposure. Catering gets 4.5%, food away from home plus event-labor intensity. Venue gets 3.8%, services inflation plus peak-date demand. Rings get 2.8%, because lab-grown stones now account for 61% of engagement ring center stones and are pulling average prices down against rising gold.
Plan your 2027 wedding budget holistically to capture all aspects of your wedding.
The weighted result is 4.4% per year. Applied over two years from the 2025 base, that produces the $37,281 headline.
Align your decisions with your 2027 wedding budget to create a cohesive celebration.
The scenario range
By continually refining your 2027 wedding budget, you ensure that your celebration remains within reach.
The low case assumes tariff relief and modest guest-list contraction, and lands at $35,338. The high case assumes tariff escalation and continued wage pressure in event labor, and lands at $39,285. If you want one number to plan against, use the midpoint. If you want a number that will not embarrass you, use the high case.
Work together with your partner to maintain focus on your 2027 wedding budget and shared goals.
What is modeled and what is measured
Your 2027 wedding budget can reflect your dreams while remaining grounded in financial reality.
We have tried to be strict about this distinction throughout. Anything presented as a survey finding comes from a named study with its sample size. Anything presented as a projection, index, or distribution is our model, and the assumptions are stated where it appears. The Cut Resistance Index, the overrun distribution, the fixed-cost split, and every 2027 figure are ours. The 2025 spending data, the platform usage percentages, the financing shares, and the generational behavior data are not.
If you disagree with an assumption, the structure still holds. Substitute your own inflation rate for flowers and the rest of the model absorbs it.
The 2027 Number: What the Average U.S. Wedding Will Cost
Average U.S. wedding cost, 2022 to 2027 projected
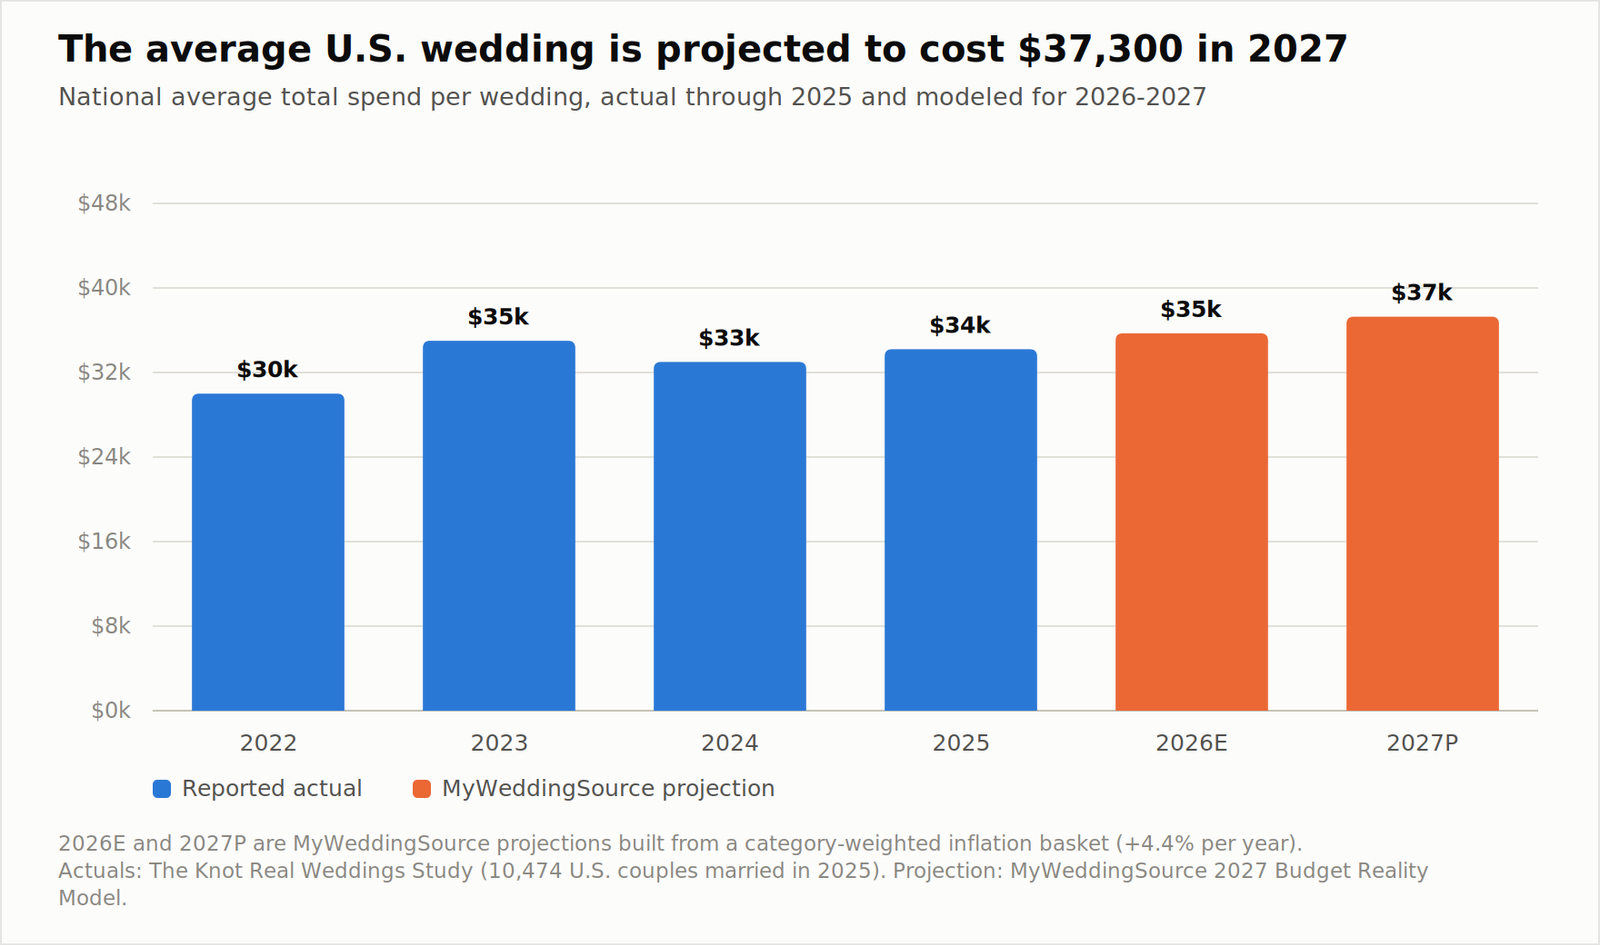
Our model projects $37,281 for the average U.S. wedding in 2027, up from a published $34,200 for weddings held in 2025 and a modeled $35,705 for 2026.
That is a 9.0% increase over two years. It is not a spike, and it is not a crisis. It is roughly one percentage point per year above general consumer inflation, driven by a handful of categories with unusual import and labor exposure.
Couples should be aware of how their 2027 wedding budget influences not just their planning but also their overall financial health.
The 2022 to 2025 series is worth understanding before you read the projection, because it does not move the way most people expect. The average was $30,000 in 2022, jumped to $35,000 in 2023, fell to $33,000 in 2024, and recovered to $34,200 in 2025.
The 2023 peak and the 2024 decline were not primarily price effects. They reflect the tail of postponed pandemic-era weddings, which skewed toward larger and more expensive events, working through the market and then clearing. By 2025 the composition of the market had normalized, and the 2025 to 2027 movement is closer to a pure price effect.
That distinction matters for how you read the projection. We are not forecasting that couples will choose more expensive weddings. We are forecasting that the same wedding will cost more.
Why $37,300 and not $34,200
The single most common budgeting mistake we see is planning a 2027 wedding against a figure published for 2025 weddings. Industry studies survey couples after the fact, so the average you find in early 2026 describes weddings that happened in 2025 and were priced by contracts signed in 2023 and 2024.
If you sign a venue contract in late 2026 for an October 2027 date, you are buying at 2027 prices with a deposit paid at 2026 prices, and every vendor you book after that will quote you their 2027 rate. Using a 2025 average as your planning anchor puts you about $3,100 behind before you have made a single decision.
The range, and why you should plan against the top of it
Establishing a clear 2027 wedding budget can help guide your planning decisions effectively and reduce stress.
2027 wedding cost inflation by category
Our scenario range runs from $35,338 to $39,285. The spread is about $3,950, which is roughly 11% of the midpoint.
Most of that spread sits in three categories. Flowers, attire, and event rentals together account for about $6,000 of the average wedding and carry nearly all of the tariff exposure. If import costs on cut flowers and imported gowns ease, those three lines pull the total toward the low case. If they escalate, the same three lines push it toward the high case.
There is a practical asymmetry here that is worth planning around. If you budget against the low case and the high case happens, you are short by about $3,950 at a point in planning when your remaining flexibility is limited. If you budget against the high case and the low case happens, you finish under budget. The costs of being wrong are not symmetric, so your planning number should not sit in the middle of the range.
Where the national average does not apply to you
average wedding cost by region
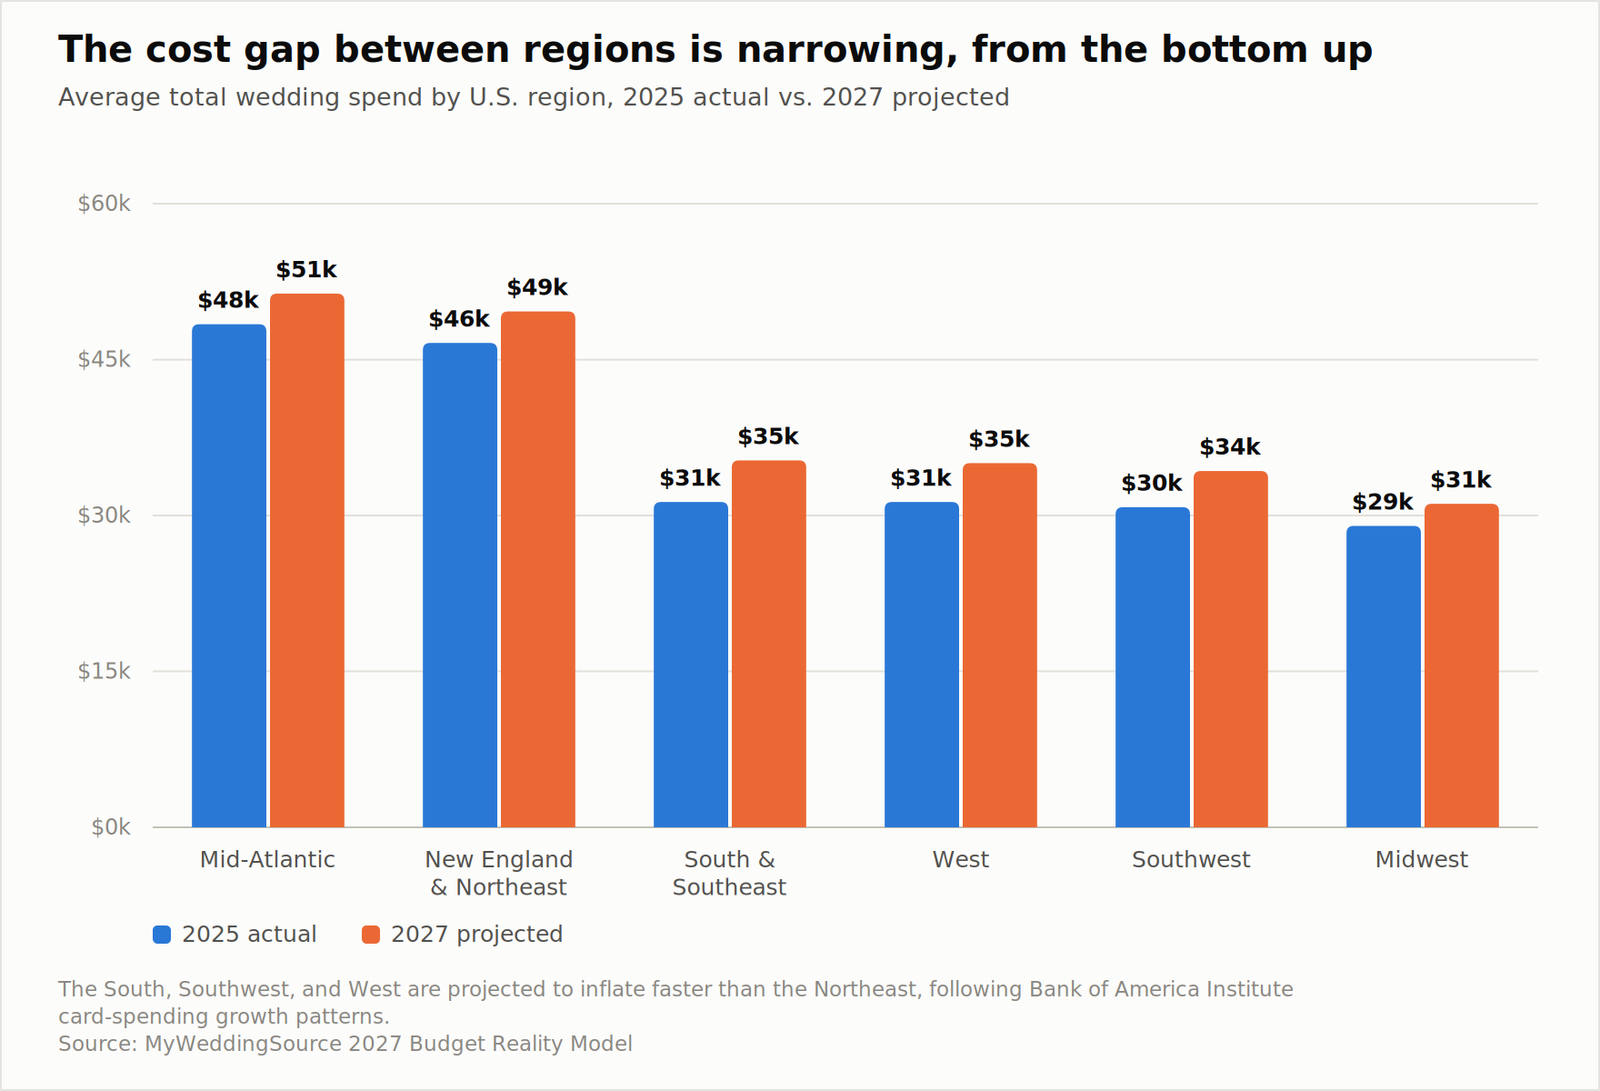
A national average is a weighted blend of markets that barely resemble each other. Our 2027 regional projections run from $31,126 in the Midwest to $51,348 in the Mid-Atlantic, a spread of more than $20,000 on the same event.
The gap is narrowing, but from the bottom up rather than the top down. Bank of America’s transaction data shows the South growing nearly five times faster than the Midwest and the West growing about four times faster than the Northeast. Our regional projections follow that pattern, which means couples in the South, Southwest, and West are absorbing faster price increases from a lower base, while the Northeast is inflating more slowly from a much higher one.
If you are planning in a metro market, the regional figure still understates your costs. Published city-level data puts Manhattan near $99,000 and San Francisco near $85,000 for a 150-guest wedding, against roughly $34,000 in Tulsa and Provo. The national average is a starting point for understanding the market, not for setting your own number.
The Reality Gap: The Budget You Set vs. The Bill You Pay
Planned wedding budget vs actual spend, 2027 projection
This is the finding the report is built around, and it is the one no major study reports directly, because most studies ask couples about their spending only after the wedding is over.
Our model projects that the average couple planning a 2027 wedding will set a budget of about $31,057 and finish at about $37,281. The gap is $6,224, or 20% above plan.
When planning for a 2027 wedding budget, it is essential to have a contingency plan to manage unexpected costs.
How far over budget couples actually finish
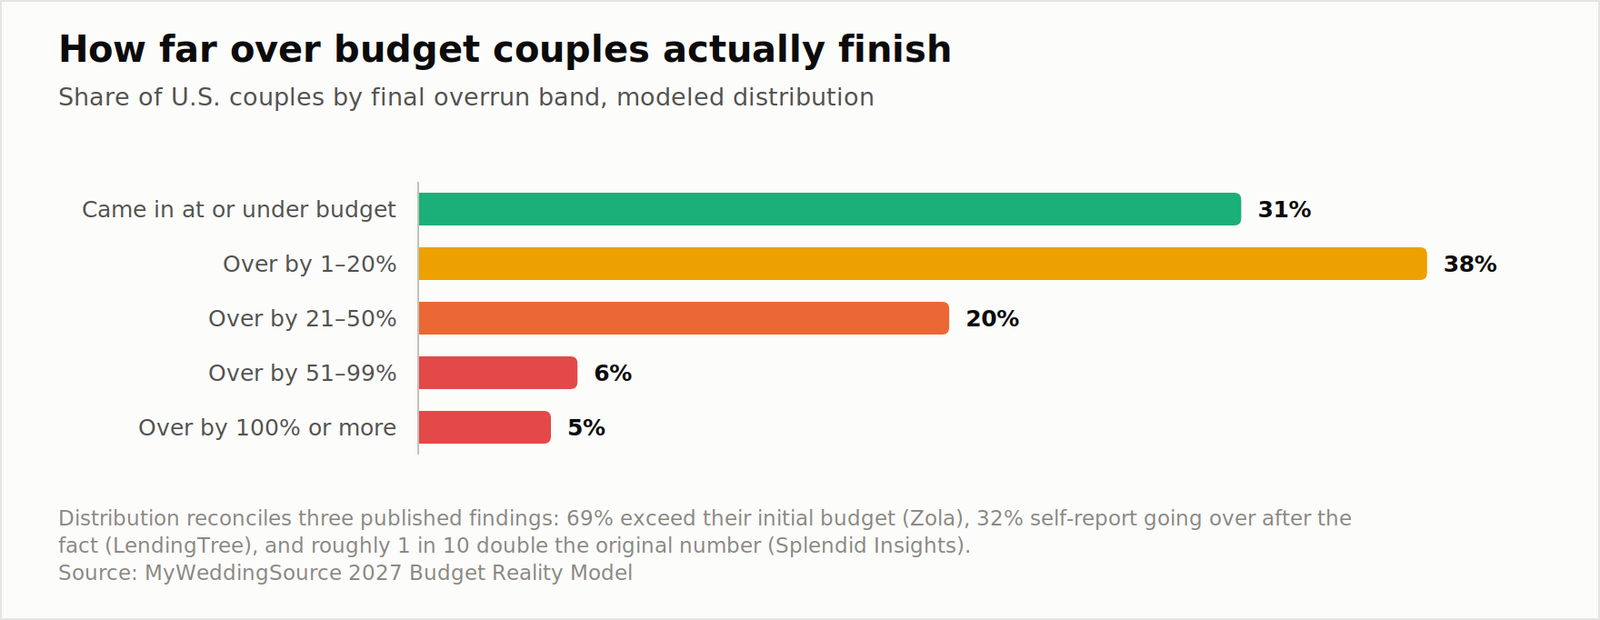
Distribution of wedding budget overruns
The average conceals a wide distribution, and the distribution is more useful than the average.
About 31% of couples come in at or under the budget they set. That is a meaningful share and worth stating clearly, because reports on this topic often imply that overspending is universal. It is not. Roughly one couple in three finishes on plan.
About 38% finish between 1% and 20% over. This is the ordinary case, and for most couples in this band the overrun is absorbable with some late reallocation.
About 20% finish between 21% and 50% over. On a $31,000 budget, that is $6,500 to $15,500 of unplanned spending, and it is the band where financing decisions usually get made.
About 6% finish between 51% and 99% over, and about 5% finish at double their original budget or more. That last group is small but it is not marginal. Splendid Insights, which surveyed 53,493 couples globally, found roughly one couple in ten doubling their original number.
When planning for a 2027 wedding budget, it is essential to consider additional elements that may not be included initially. Couples often overlook the significance of accurately estimating their total costs, which can lead to overspending. The gap between the planned budget and the final wedding expenses can be substantial, emphasizing the importance of detailed financial planning for the 2027 wedding budget.
Why couples under-report their own overruns
Budgeting for a 2027 wedding budget requires diligence and a willingness to adapt as costs fluctuate.
Here is a discrepancy in the published data that turns out to be one of the more interesting findings in this report.
LendingTree’s survey of 1,050 newlyweds, conducted after their weddings, found 32% saying they went over budget. Zola’s 2026 data, which compares the budget couples set against what they report spending, found 69% exceeding their initial budget. These are not contradictory findings about different populations. They are the same behavior measured at different points in time.
What happens in between is budget revision. A couple sets $30,000 in month one. In month four the venue quote comes in higher than expected and they revise to $34,000. In month eight the guest list grows and they revise to $37,000. They finish at $37,500. Asked afterward whether they went over budget, they compare $37,500 against $37,000, say they came in slightly over, and mean it sincerely.
The original $30,000 is gone. It was not abandoned in a single decision, so there is no moment to remember. This is the single most useful thing to understand about wedding budgeting: the budget does not usually break. It drifts.
The five places the gap opens
Our model and the underlying survey data point to five specific sources, in rough order of size.
Service charges and taxes on the venue and catering contract. Published data indicates 57% of couples encounter mandatory venue service charges and 75% experience unexpected fees. A 22% service charge plus sales tax on a $19,000 food, beverage, and venue package is roughly $4,900 that was not in the per-person price you compared against. This is the largest single contributor.
Guest list growth after the budget is set. At a projected marginal cost of about $262 per guest in 2027, an additional 12 guests is roughly $3,100. Guest lists grow late, after invitations prompt family conversations, and by then the catering minimum has usually been contracted.
Category creep in the last four months. Alterations, a second photographer, extra florals for a ceremony space that photographs poorly, upgraded linens, a shuttle nobody planned. Individually these are $300 to $900 decisions. Collectively they run $2,000 to $4,000.
Overtime and day-of costs. Venue overtime rates, vendor overtime, extended bar service, additional staffing. These are contractual, disclosed, and almost never budgeted, because at signing nobody expects to run long.
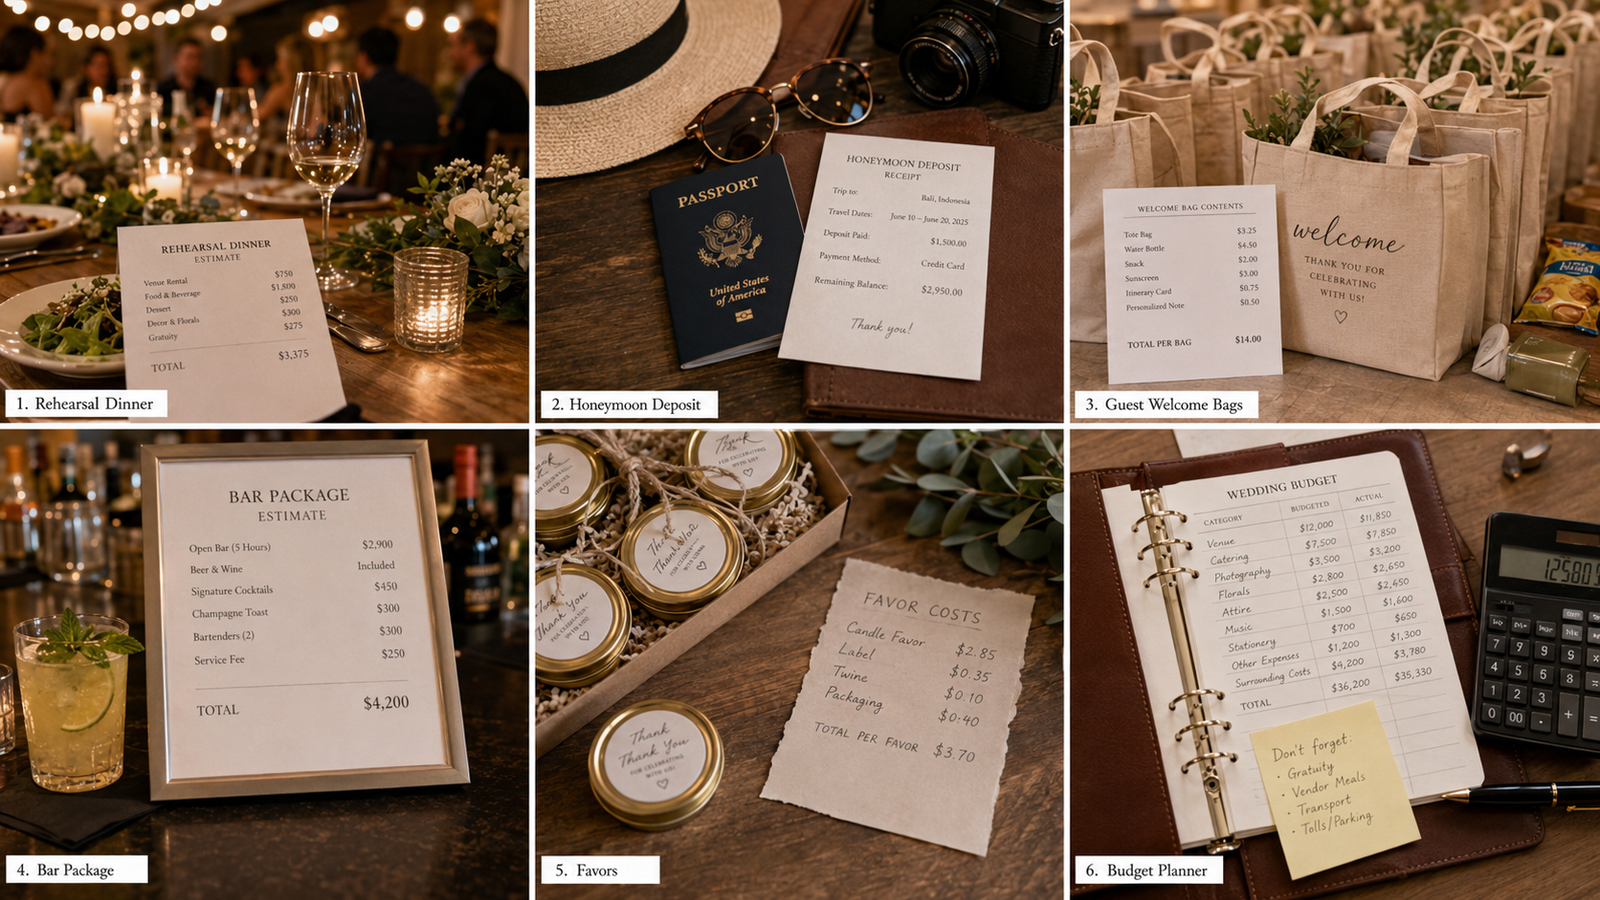
Personal and preparation costs outside the event. Zola’s data puts average spending on beauty, physical health, and mental wellness at $1,100 per couple, plus a separate rehearsal dinner averaging about $2,800. Neither typically appears in a wedding budget spreadsheet, and both are real money.
If you want a single practical takeaway from this section: the gap is not caused by one large mistake. It is caused by five ordinary things, each of which is individually defensible.
Where the $37,300 Goes: The 2027 Wedding Budget Breakdown
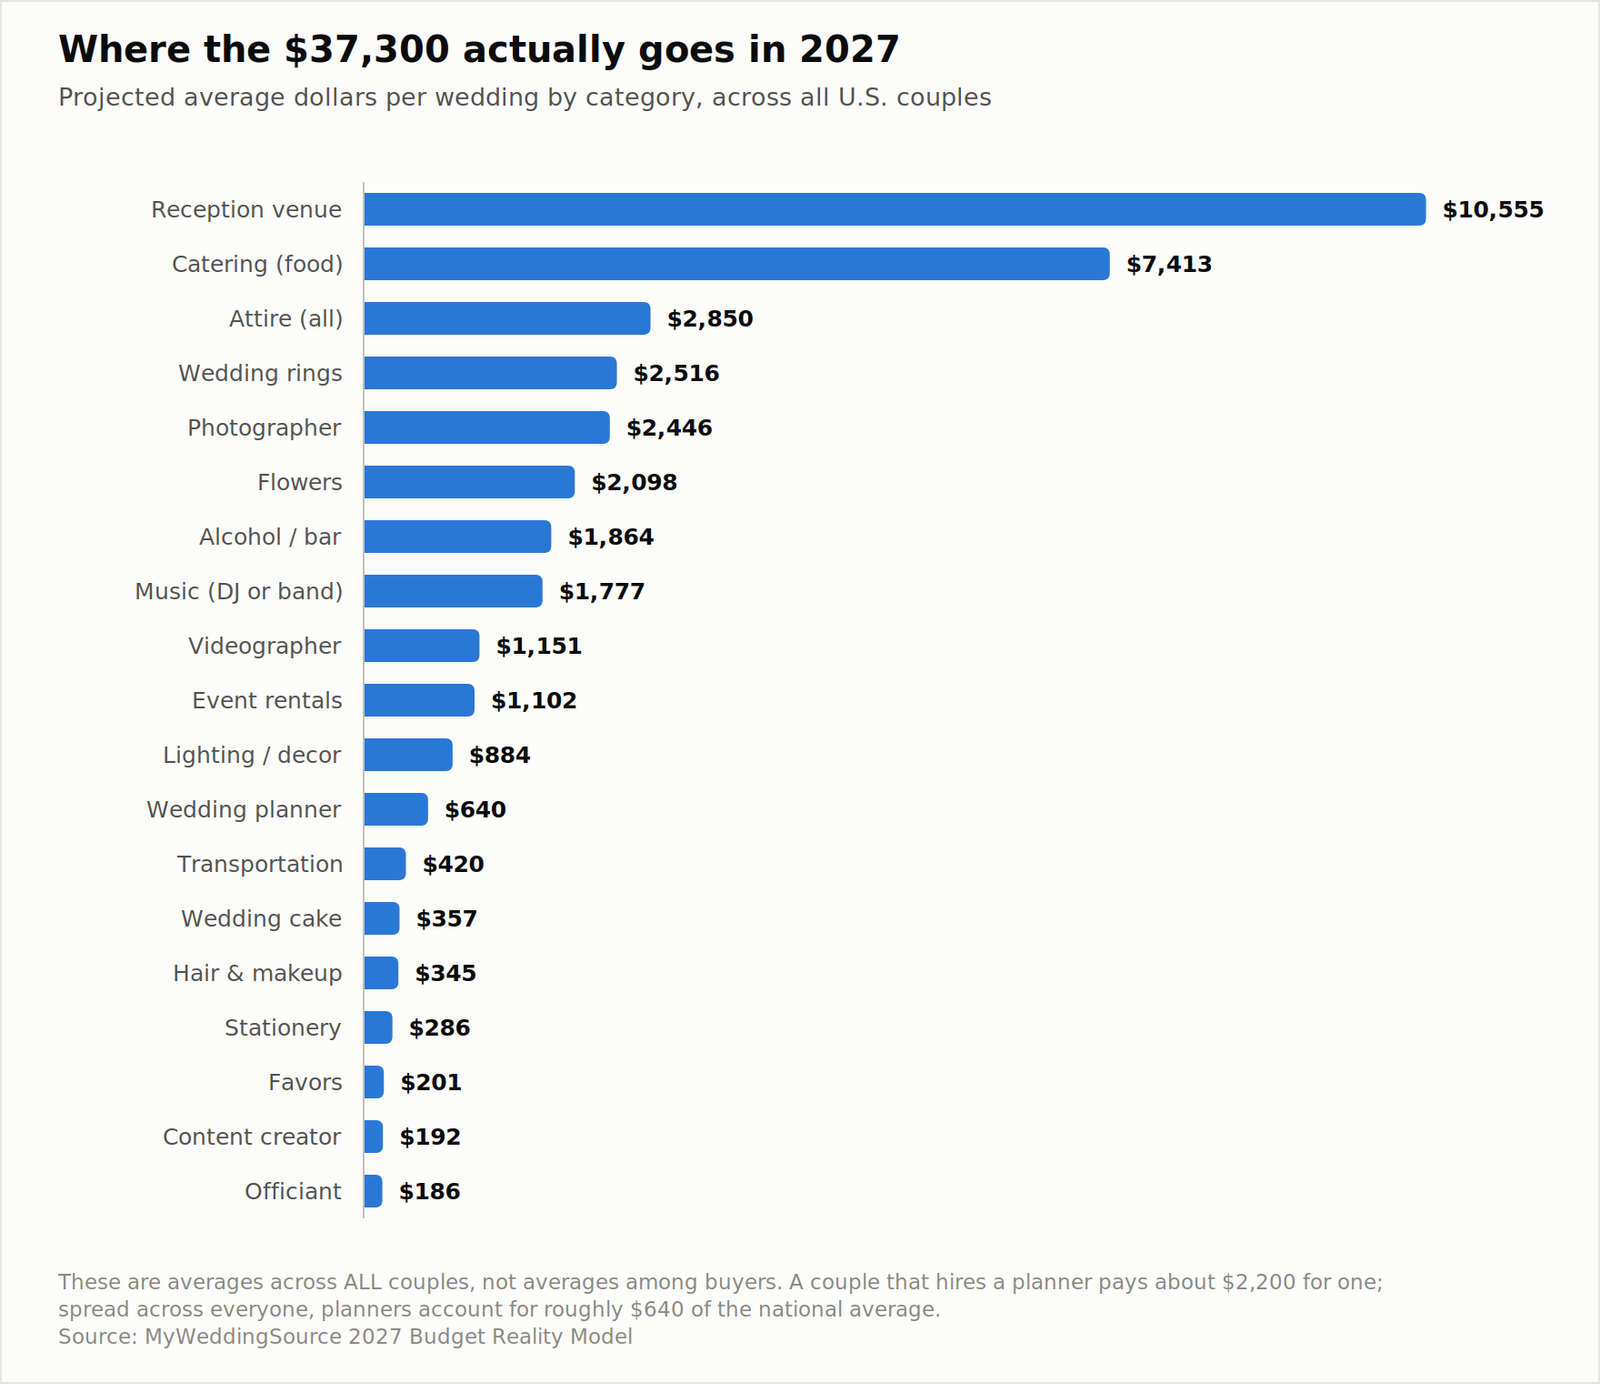
2027 wedding budget breakdown by category
Most published budget breakdowns give you a percentage list: venue 40%, catering 20%, photography 10%, and so on. Those lists are directionally fine and practically misleading, because they blend two different measurements without saying so.
Understanding the 2027 wedding budget can significantly influence how couples allocate their funds throughout the planning process.
When an industry study reports that the average wedding planner costs $2,100, it means the average among couples who hired a planner. Only about a third of couples do. Spread across all couples, planners account for roughly $640 of the national average, not $2,100.
This distinction changes how you should read every category figure you find online. If you add up the published category averages, you get a wedding costing roughly $41,000, about 17% more than the actual average of $34,200 for 2025 weddings. The list is not wrong. It just describes a couple who bought every single category, and almost nobody does.
In managing your 2027 wedding budget, it is also crucial to prioritize spending on elements that matter most to you as a couple. By aligning your budget with your values and expectations, you can avoid unnecessary expenditures while ensuring that your wedding reflects your personal style and preferences. The 2027 wedding budget should support your vision without compromising on quality.
The table below gives you both numbers, so you can use the right one for the right purpose. Use the “among buyers” column to estimate what a specific vendor will quote you. Use the “contribution” column to understand how the national average is constructed.
The full 2027 category table
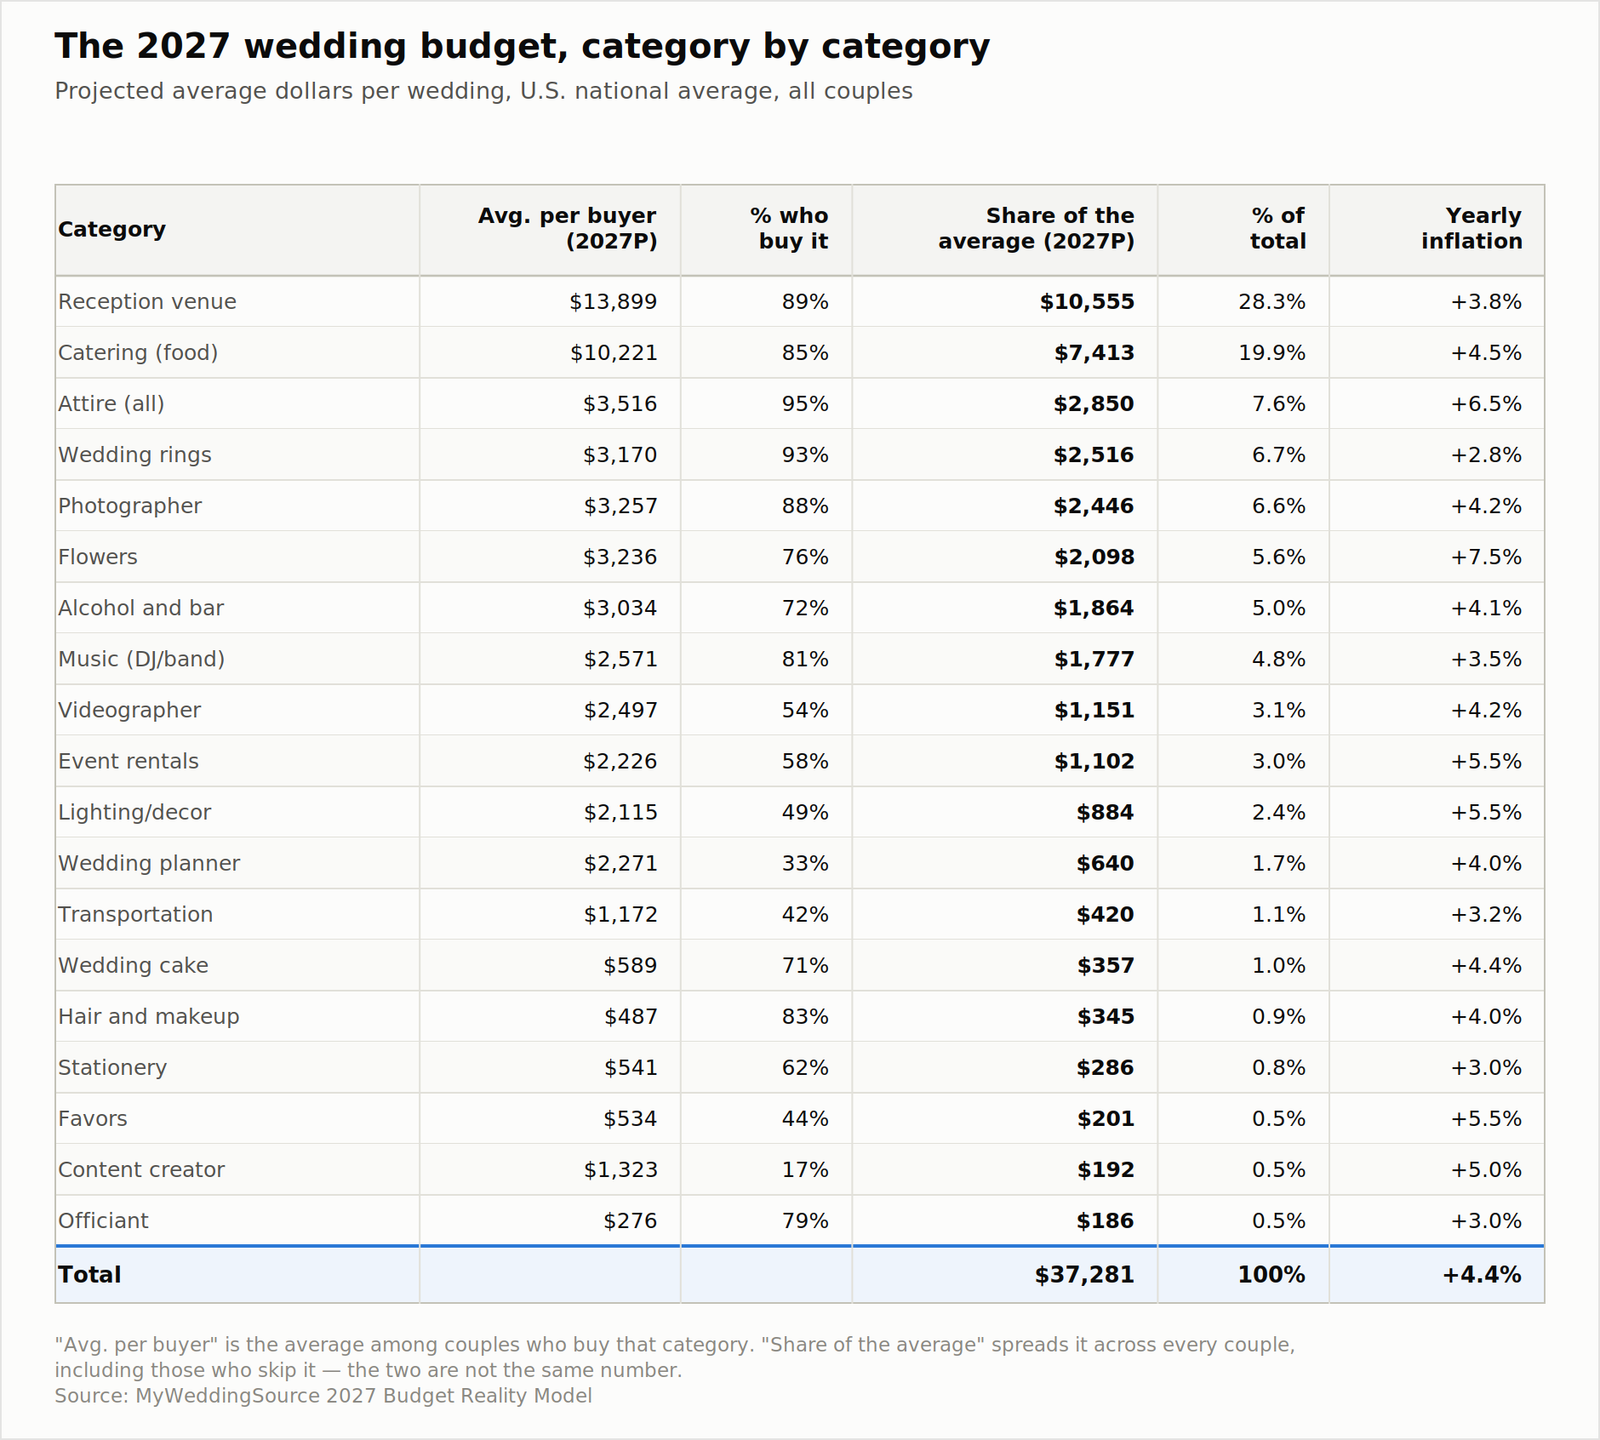
2027-wedding-budget-category-table
Note that the venue and catering lines together account for 48.2% of the national average. Almost half of the total sits in a single contract, usually signed first, usually before the couple has a reliable estimate of anything else. That sequencing is the structural reason budgets drift, and it is worth thinking about before you sign.
What this table does not include
Three categories that are real money and that our model treats separately, because they are typically excluded from wedding budget totals in the underlying studies:
The engagement ring, at a published average of $4,600. The honeymoon, at roughly $5,500. The rehearsal dinner, at roughly $2,800.
Add those to the projected 2027 average and the full cost of getting married approaches $50,000. If someone in your family is comparing your wedding to theirs from a decade ago, this is part of why the comparison feels off.
Guest List Math: Why Cutting Guests Saves Less Than You Think
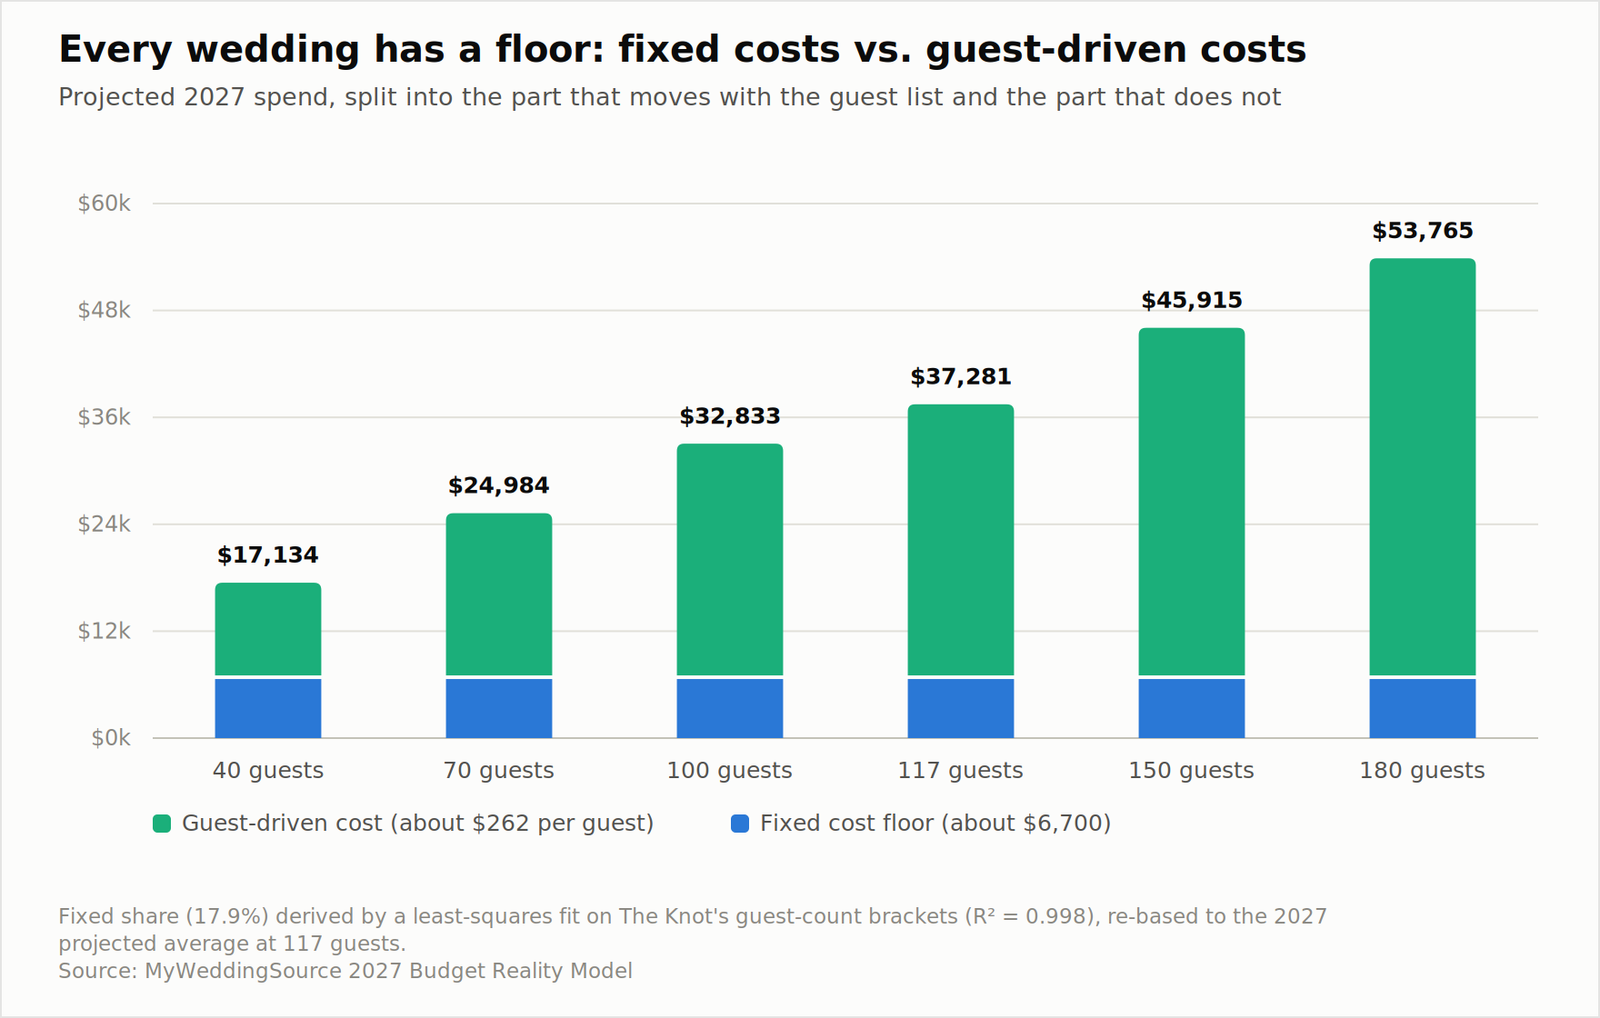
Fixed vs variable wedding costs by guest count
“Cut the guest list” is the most common piece of wedding budget advice in circulation. It works, but it works less well than the way it is usually described, and understanding why will keep you from making a painful cut that does not deliver what you expected.
The fixed cost floor
We fit a linear model to The Knot’s published cost-by-guest-count brackets: $17,100 for weddings of 1 to 50 guests, $27,200 for 51 to 100, and $43,300 for 100 or more, using bracket midpoints of 35, 75, and 130. The fit is close, with an R-squared of 0.998, which tells you the relationship between cost and guest count is close to linear with a substantial intercept.
That intercept is the fixed cost floor. Re-based to our 2027 projection, it comes to about $6,668, or 17.9% of the average total. The marginal cost of each additional guest is about $262.
The floor is made of things that do not care how many people show up. Photography is priced by hours of coverage, not head count. Your attire costs the same for 60 guests as for 160. The officiant fee, the marriage license, the DJ’s minimum, the ceremony musicians, the planner’s fee, most of the florals for the ceremony space, and a large share of the venue’s base rental all sit in this bucket.
What 20 fewer guests actually saves
For successful budgeting, keep in mind the importance of anticipating costs associated with your 2027 wedding budget.
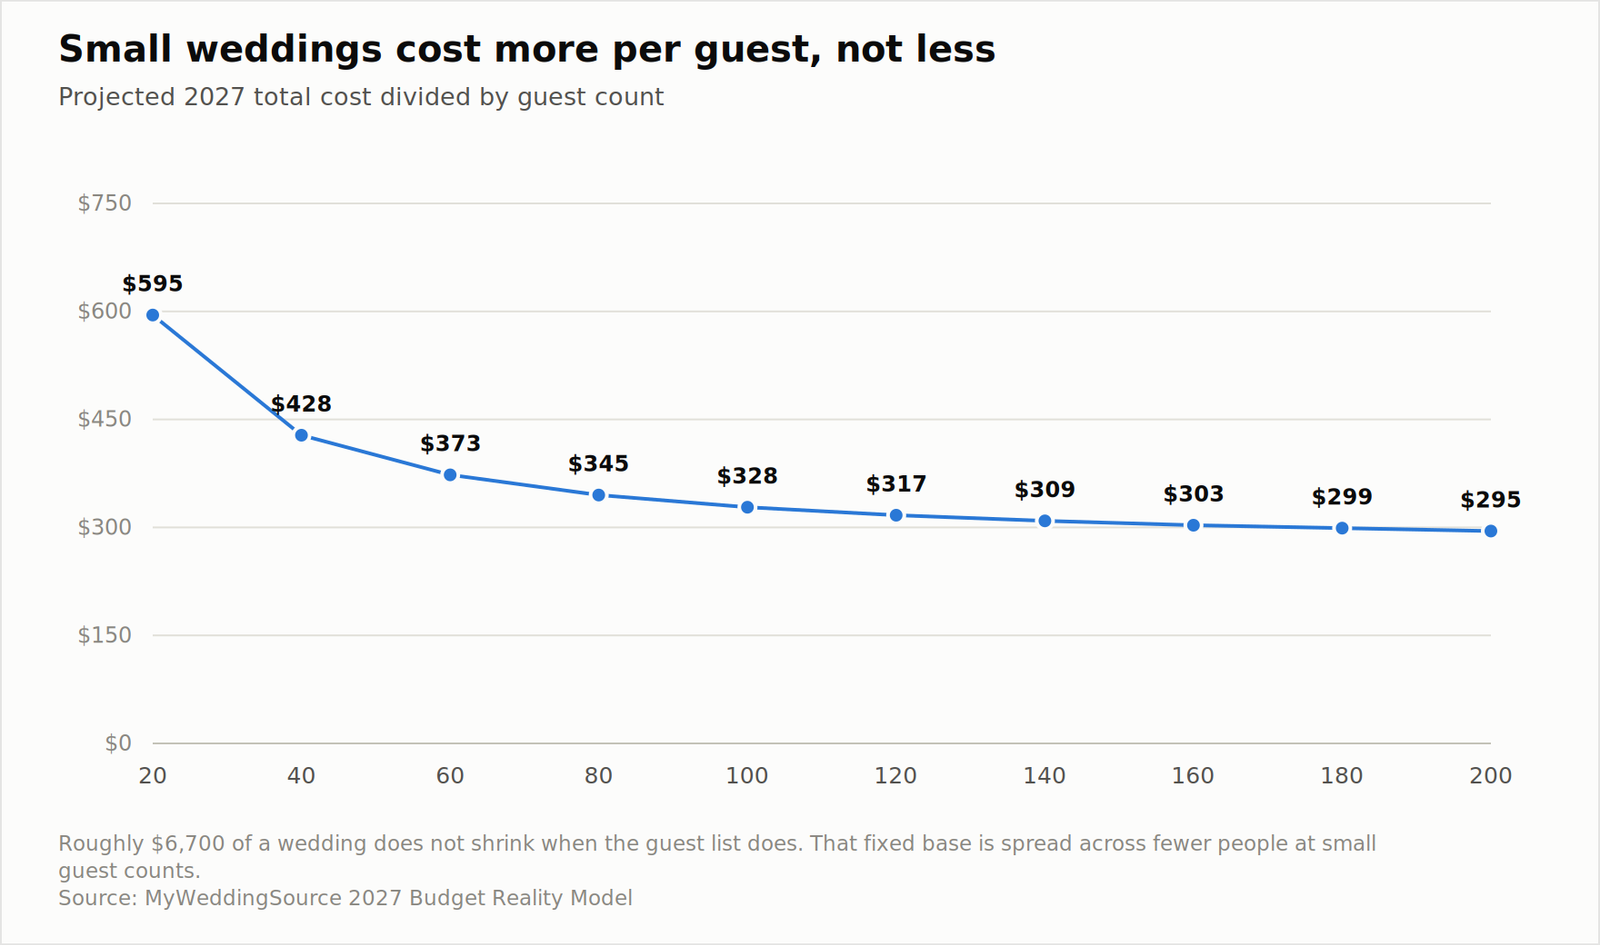
Wedding cost per guest by guest count
Here is the arithmetic couples usually do. Total budget $37,281, divided by 117 guests, is $319 per guest. Cut 20 guests and save $6,373.
Here is what actually happens. Twenty guests times the marginal cost of $262 is $5,233. You are about $1,140 short of what you expected, or roughly 18% off.
That is not a trivial error on its own, and it compounds if you build several assumptions on top of it. A couple that plans to close a $12,000 gap by cutting 45 guests will actually close about $11,790 of it, which is close enough. A couple that plans to close a $12,000 gap by cutting 25 guests and trimming florals will find themselves several thousand dollars short.
The per-guest curve makes the same point from the other direction. At 40 guests, our model projects a cost per guest of about $428. At 117 guests, about $319. At 200 guests, about $295. The cost per guest falls as the wedding gets larger, which is the opposite of what most small-wedding advice implies.
When cutting the guest list does work well
None of this means the guest list is the wrong lever. It means you should use it with accurate expectations, and there are situations where it is by far the most effective tool available.
It works well when you are above a venue’s capacity tier, because dropping below a threshold can change the venue entirely and take fixed costs down with it. It works well when you are above a catering minimum, because falling under the minimum spend converts a variable cost into a smaller fixed one. It works well before contracts are signed, when the guest count still determines which venues you are looking at. And it works well when the cut is large, because at 40 or 50 fewer guests the variable savings are big enough that the fixed floor stops mattering.
It works poorly when you are trying to save the last $2,000 six weeks out. At that point you have already paid or committed most of the floor, the catering minimum is contracted, and cutting eight guests saves about $2,100 in theory and often much less in practice, while costing you real relationships.
Working within your 2027 wedding budget means making informed decisions about what to prioritize and what can be adjusted.
The practical version
If you want a rule you can use without a spreadsheet: assume each guest you cut saves you about 80% of your average cost per guest, not 100%. If your average is $320 per guest, plan on saving about $255 per person removed. That is close enough to our modeled $262 for planning purposes, and it will keep you from over-promising yourself.
What Couples Protect and What They Cut First
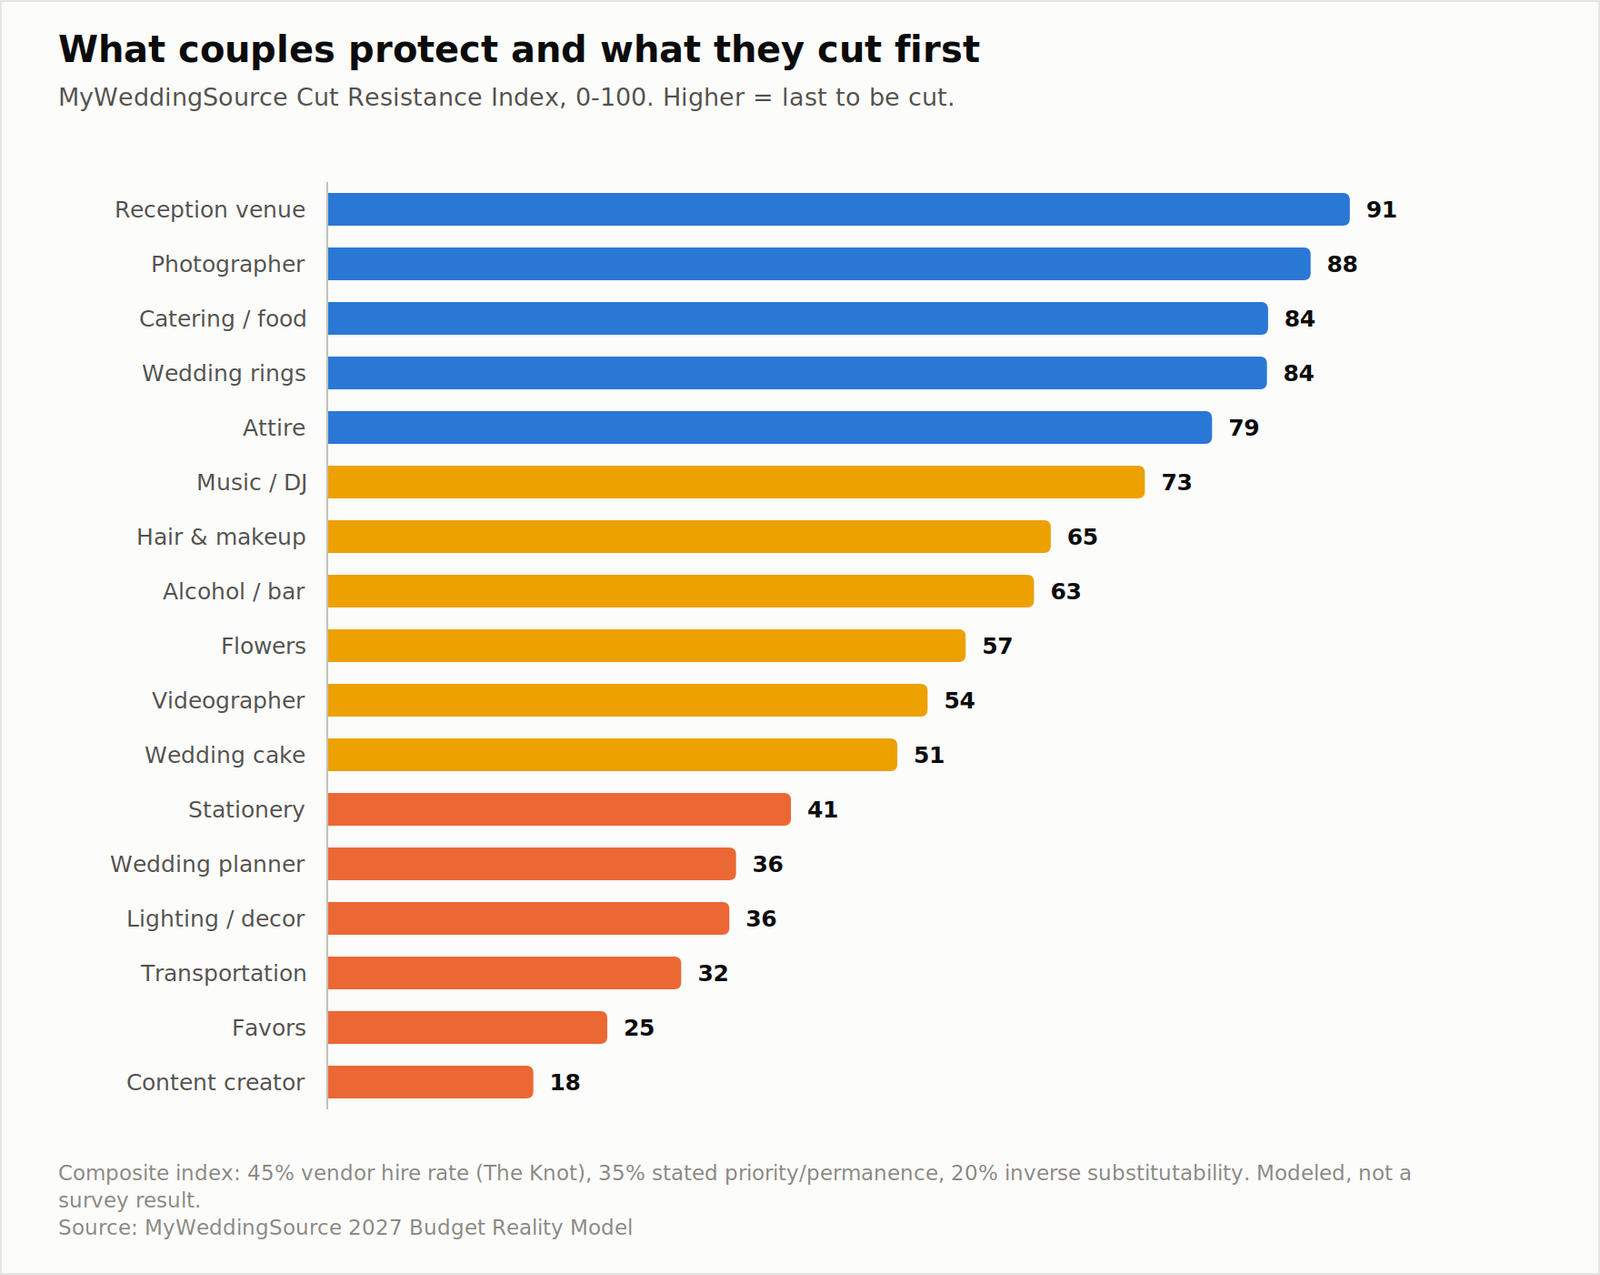
Wedding budget cut resistance index
When a budget gets tight, couples do not cut proportionally across all categories. They cut in a fairly consistent order, and knowing that order in advance is more useful than any general advice about saving money.
We built a Cut Resistance Index to rank it. It is a composite score from 0 to 100, weighted 45% on the share of couples who hire that vendor category at all, 35% on stated priority and permanence, and 20% on how easily the category can be substituted or self-supplied. It is a model, not a survey result, but it is built on published hire rates and it matches what vendors report seeing.
The protected top
To maximize your 2027 wedding budget, consider ways to cut costs without sacrificing quality or guest experience.
Reception venue (91), photographer (88), catering (84), and wedding rings (84) sit at the top and are cut last, if ever.
The venue is protected for a structural reason rather than an emotional one: by the time a budget problem becomes visible, the venue is contracted and the deposit is non-refundable. It is not so much protected as locked.
Photography is protected for a genuinely different reason, and it is the most interesting entry on the list. It has an 88% hire rate, essentially tied with the venue, despite being a discretionary service that produces nothing on the day itself. Couples treat it as the one purchase that outlasts the event. When budgets tighten, couples more often downgrade the package than remove the vendor, moving from ten hours to six rather than from a professional to a friend with a camera.
Food is protected because it is the guest experience. A couple that has already cut 30 people from the list will resist cutting the quality of what those remaining people eat, and that instinct is generally sound.
The vulnerable bottom
Content creator (18), favors (25), transportation (32), lighting and decor (36), and wedding planner (36) go first.
Favors are the clearest case in the data. A 44% hire rate and a $534 average among buyers make it a small line item with almost no defenders. Most couples who skip favors report that no guest noticed.
Transportation is more consequential than its ranking suggests. It is cut early because it feels like a convenience, but removing a shuttle in a venue with limited parking or a bar-service wedding creates guest problems that cost you goodwill rather than money. This is a place where the ranking reflects what couples do rather than what works well.
Evaluating your 2027 wedding budget can provide clarity on what elements are essential and which can be modified.
The wedding planner ranking deserves a caveat. It scores low because only 33% of couples hire one, which drags the composite down, not because couples who hire planners readily fire them. Among the couples who do hire one, a planner is generally protected. And there is an argument, supported by the overrun data in this report, that a partial-planning or month-of coordination package pays for a meaningful portion of itself by preventing exactly the late-stage cost creep that opens the reality gap.
The middle, where the real decisions happen
Attire (79), music (73), hair and makeup (65), alcohol (63), flowers (57), videography (54), and cake (51) occupy the middle, and this is where most actual budget decisions get made.
Flowers at 57 is worth flagging given our inflation projection of 7.5% for the category. Florals are simultaneously the fastest-inflating major line and one of the easier ones to reduce without guests noticing, because a large share of floral spend goes to installations and centerpieces where a smaller design reads as intentional rather than reduced. If you are looking for one category to attack, this is statistically the best candidate in 2027.
How to use this ranking for your own budget
The point of the index is not to tell you what to protect. It is to tell you what you are likely to protect by default, so you can check whether that default matches your actual priorities.
Sit down with your partner and rank your own top five before you get a single quote. If your personal ranking puts food and music at the top and photography sixth, that is a legitimate set of priorities, and knowing it early lets you allocate deliberately rather than discovering in month nine that you have quietly funded the industry’s default hierarchy instead of your own.
Who Pays in 2027: Parents, Savings, Credit, and the Registry
When planning your 2027 wedding budget, remember to account for all potential contributions and expenses.
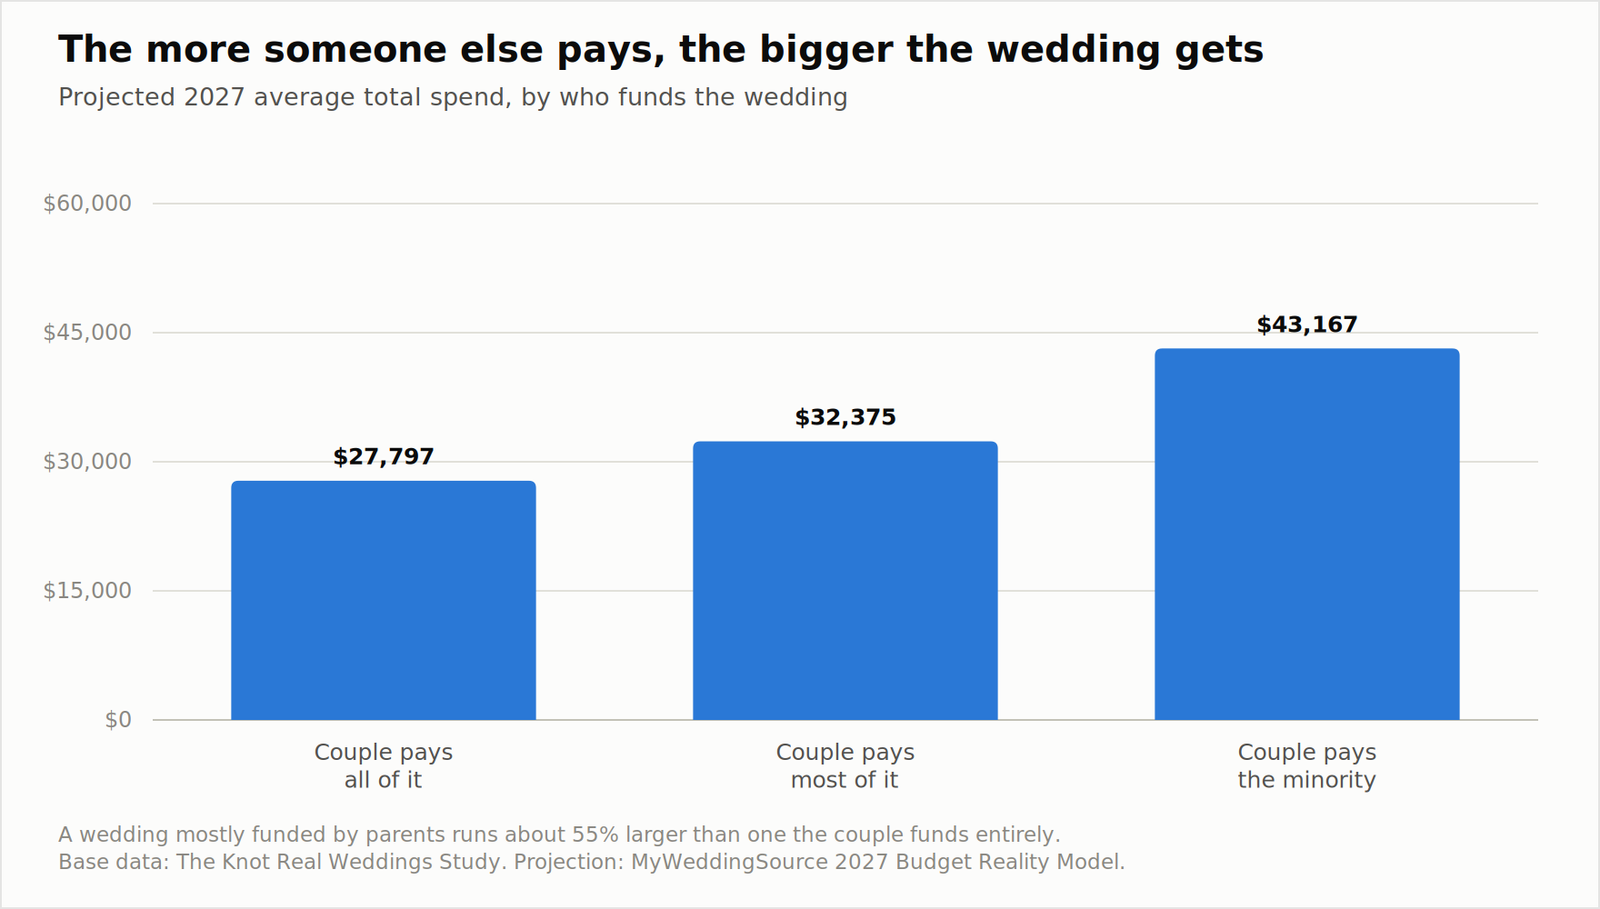
Who pays for the wedding and what it costs
The funding question changes the budget question more than most couples expect, and the direction of the effect is not obvious until you see it in the data.
The parental contribution premium
The Knot’s data on 2025 weddings shows a clear pattern by who funds the event. Couples who paid for everything themselves averaged $25,500. Couples who paid the majority averaged $29,700. Couples who paid the minority, meaning parents or family covered most of it, averaged $39,600.
Projected to 2027, those figures become roughly $27,797, $32,375, and $43,167.
A wedding funded mostly by family costs about 55% more than one the couple funds entirely. That is not a small effect, and it is worth being honest about what causes it. Part of it is straightforwardly that more money is available. But part of it is that contributed money comes with expectations attached, most commonly about the guest list. A parent contributing $20,000 usually has names to add, and at a marginal cost of $262 per guest, thirty additional names is roughly $7,900 that the couple did not plan and cannot easily decline.
If someone offers to contribute, the useful conversation is not about the amount. It is about whether the contribution is a gift toward the wedding you are planning or a stake in a somewhat different wedding. Both are legitimate. They lead to very different budgets, and the time to establish which one it is is before the venue tour, not after the guest list draft.
Zola’s 2026 data indicates 71% of couples receive some financial help from family, and 69% of those report both families contributing. Meanwhile 88% of couples contribute their own money, with 29% funding the wedding entirely themselves. Those numbers overlap, which is the point: the modal 2027 wedding is jointly funded, and joint funding needs an explicit agreement rather than an assumption.
How couples are paying for the rest
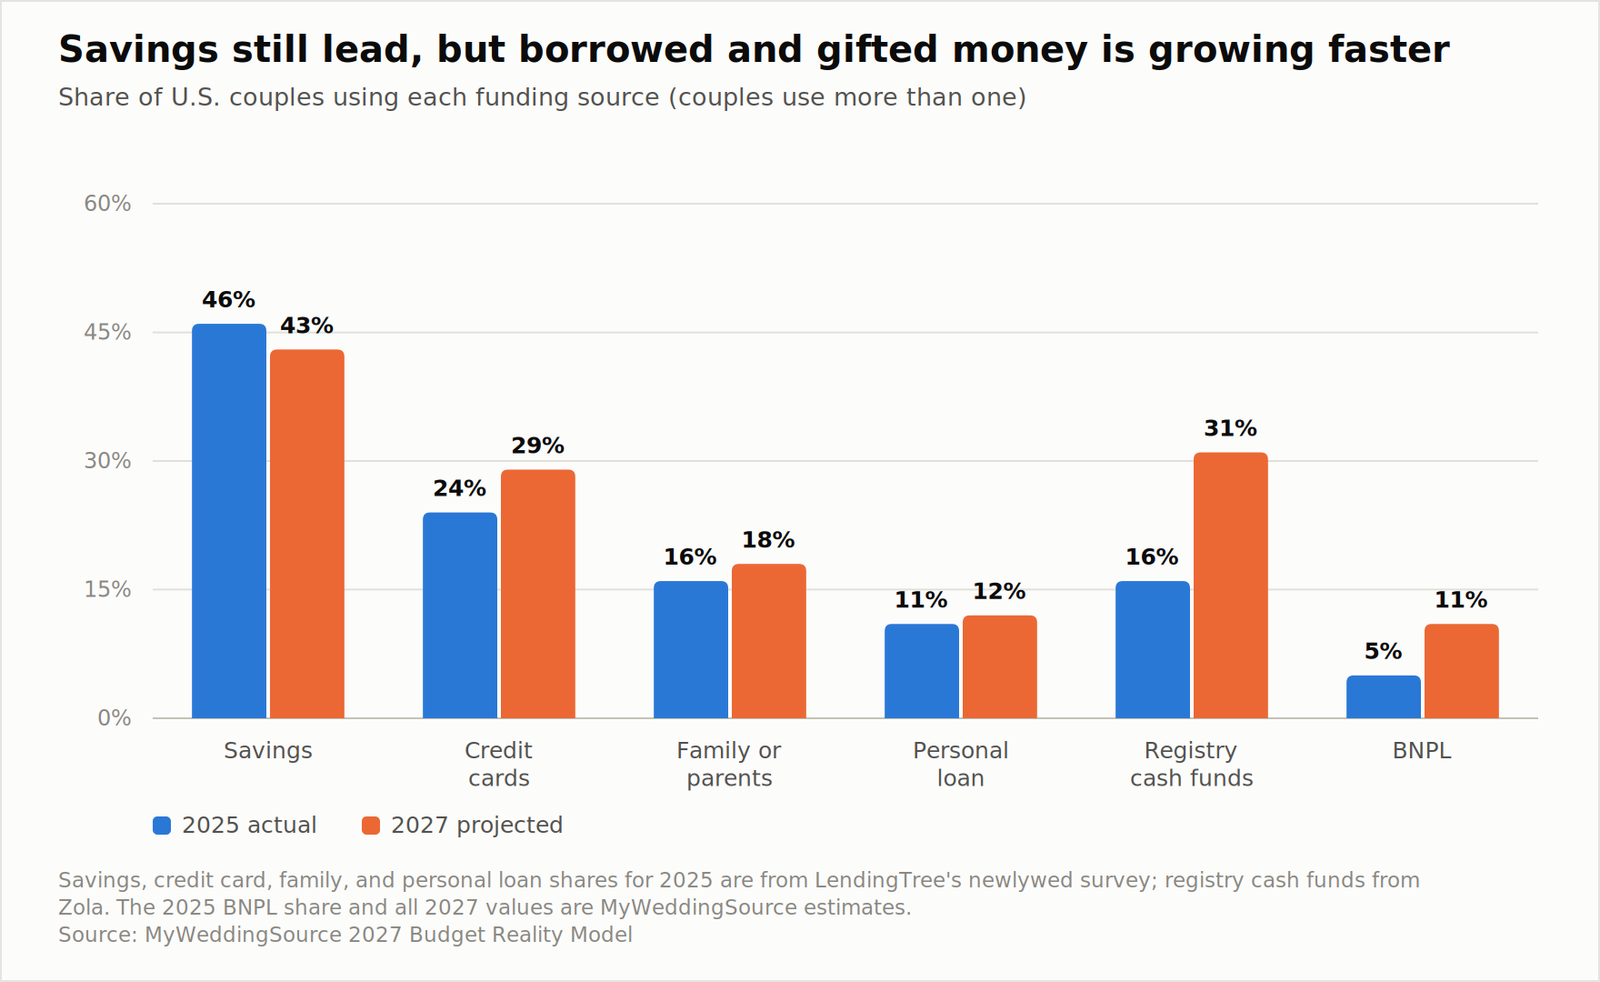
How couples pay for weddings, 2025 vs 2027 projected
LendingTree’s newlywed survey found savings as the leading source at 46%, followed by credit cards at 24%, family help at 16%, and personal loans at 11%.
Our 2027 projections move savings down slightly to 43% and credit cards up to 29%, with buy-now-pay-later roughly doubling from an estimated 5% to 11%. The direction is consistent with broader consumer credit trends, and with the fact that couples are paying more against savings that have not grown proportionally.
The most striking movement is not in borrowing at all. It is in registry cash funds, which Zola reports at 16% of couples in 2025 and 27% in 2026, a projected 31% by 2027. That is close to doubling in two years, and it represents a genuine structural change in how weddings get financed. A cash fund converts part of the gift economy into wedding funding, which is more efficient than a fourth set of serving dishes but which also, in practice, arrives after most of the money has already been committed.
The timing problem with registry funds
This is worth a specific warning, because it is a mistake we see repeatedly. Registry cash funds do not arrive when you need them. The bulk of gifts land in the two weeks around the wedding, and a meaningful share arrive after. Final vendor payments are typically due 14 to 30 days before the date.
If your budget depends on registry contributions to close a gap, you are relying on money that will arrive after the bill is due, which means you are actually relying on a credit card float you have not planned as one. Treat registry funds as reimbursement for money you have already spent, not as a funding source you can spend against.
The Debt Question: What Wedding Borrowing Actually Costs
LendingTree’s survey of 1,050 U.S. newlyweds found 67% took on some form of wedding-related debt. Of those, 24% were still actively paying it off at the time of the survey, and 41% expected repayment to take at least a year.
That is a large majority, and the reaction to the number matters more than the number itself.
Borrowing for a wedding is not automatically a mistake. A couple with stable income who puts $6,000 on a card and clears it in five months has made a cash-flow decision, not a financial error, and the same couple might reasonably borrow for a used car without anyone raising an eyebrow. The distinction is between debt with a defined end and debt without one.
The survey data does suggest where the line falls. Among newlyweds, 34% reported feeling pressured to overspend beyond their means, 52% reported some regret about the amount they spent, and 53% reported financial arguments with their partner before or after the wedding. Money was the single biggest planning stressor for 23%.
The regret figure is more interesting than it first appears, because it splits evenly: 26% wished they had spent more, and 26% wished they had spent less. That is not a population that uniformly overspent. It is a population that, in both directions, spent an amount that did not match its own priorities. Which brings the problem back to allocation rather than total.
Three questions worth answering before you borrow
What is the payoff date, in a month you can name? “Within a year or so” is not a plan. “By March 2028, at $520 a month” is. If you cannot name the month, the amount is too large.
What is this delaying? Zola’s data indicates 52% of couples are postponing other financial goals for the wedding, including general savings for 70% of them, home buying for 59%, and debt paydown for 38%. Those are real trade-offs and they are worth making consciously. Delaying a home purchase by eight months for a wedding you both want is a decision. Delaying it by three years without noticing is not.
Would you both make this decision again? The 53% who report financial arguments are, in most cases, couples where one partner made a spending decision the other did not fully agree to. The argument is rarely about the money. It is about the process.
A well-planned 2027 wedding budget can prevent financial disputes and ensure a smoother planning experience.
Gen Z vs. Millennial: The Generational Handoff
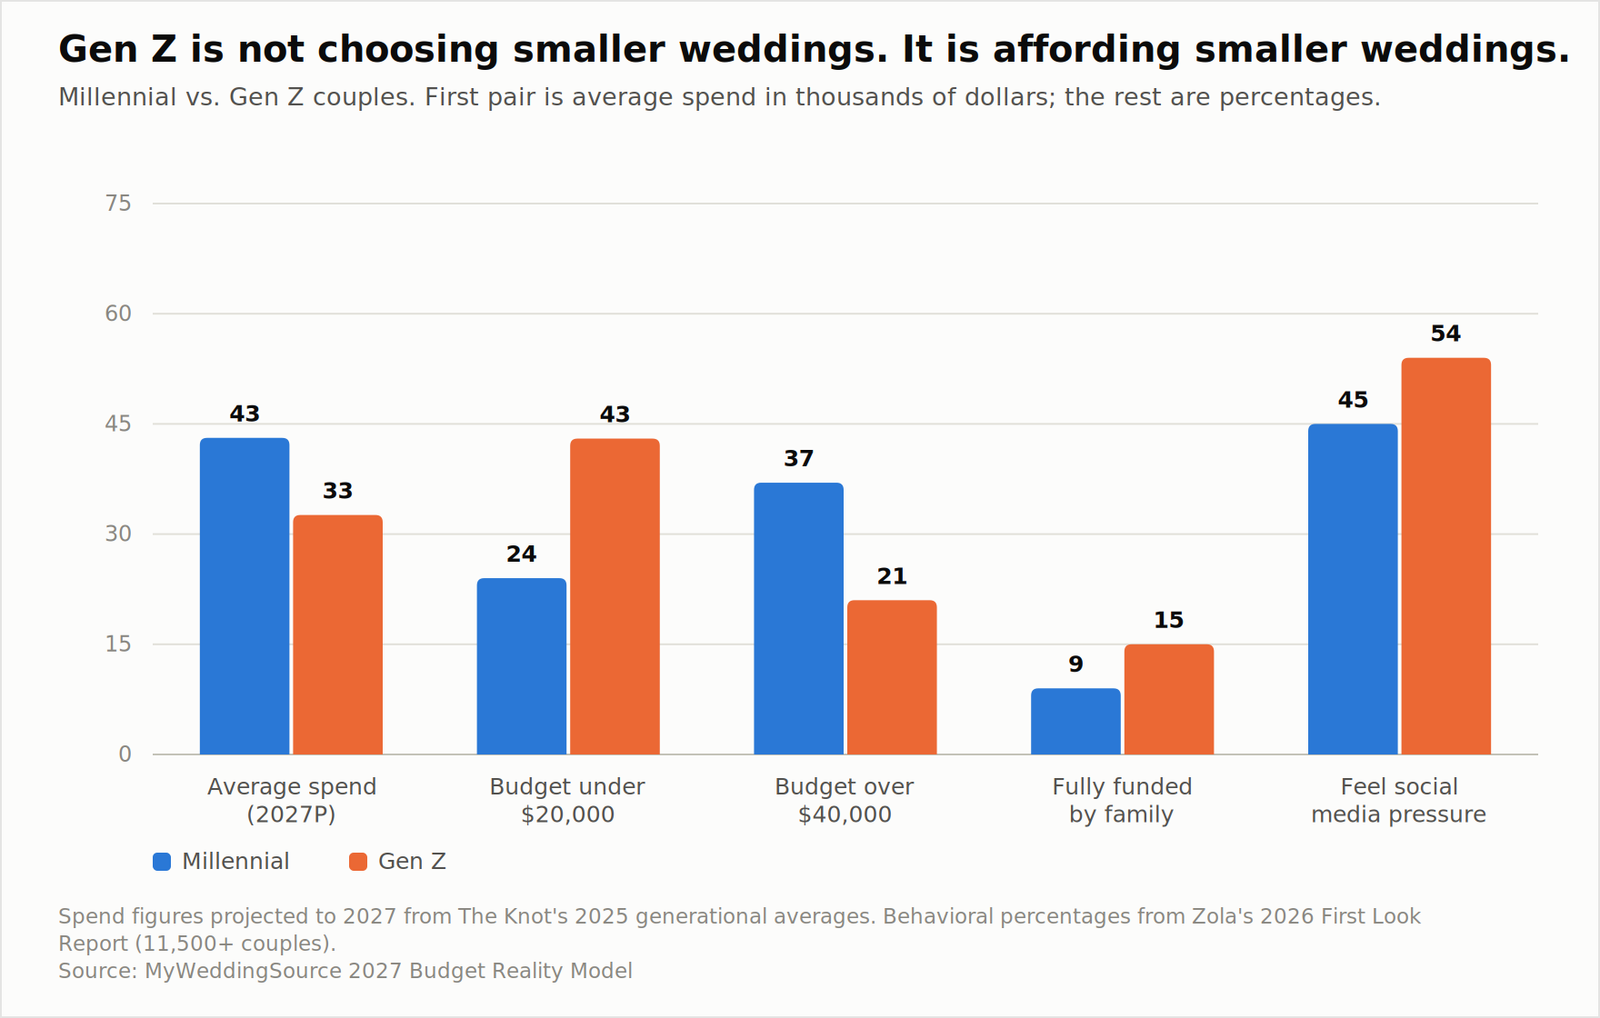
Gen Z vs Millennial wedding spending
The 2027 wedding market is in the middle of a generational transition, and the data on it is unusually clear.
Bank of America’s transaction analysis found Gen Z weddings have roughly tripled since 2019, while Millennial weddings have declined about 20% over the same period. The Knot’s 2026 study put Gen Z at 41% of the surveyed market. Zola’s 2026 survey found Gen Z at 51% of respondents, a majority for the first time.
By 2027, Gen Z is the wedding market. That changes the numbers in specific ways.
The spending gap, and what causes it
Projected to 2027, Gen Z couples average about $32,703 and Millennial couples about $43,167. Zola’s budget-band data sharpens the picture: 43% of Gen Z couples plan under $20,000, against 24% of Millennials, while 37% of Millennials plan over $40,000, against 21% of Gen Z.
It would be easy to read this as a values story, and a lot of trend coverage does. The data does not really support that reading.
Gen Z couples marrying in 2027 are roughly 22 to 30 years old. Millennial couples marrying in 2027 are roughly 31 to 43. The Millennial cohort has had a decade longer to accumulate savings, and Millennials marrying now are disproportionately marrying later with established careers. The spending difference is substantially an age and life-stage difference, not a philosophical one.
Recognizing the differences in how various generations approach their 2027 wedding budget can help tailor your planning.
Two data points support that. Gen Z couples are more likely to be fully funded by family, 15% against 9% for Millennials, which is what you would expect from a younger cohort. And Gen Z is enthusiastically reviving traditional elements that trend coverage often frames as things young couples reject: 92.2% of Gen Z couples include a wedding party against 78.8% of Millennials, 53.9% include religious customs against 37.5%, and 40% include a bouquet toss against 28.9%.
Gen Z is not rejecting the traditional wedding. It is having a traditional wedding on a smaller budget.
Where Gen Z genuinely differs
Two differences are real rather than artifacts of age.
Social pressure. 54% of Gen Z couples report feeling pressure to have a wedding that looks good on social media, against 45% of Millennials, and 29% of Gen Z plan social-first content against 18% of Millennials. This is a budget factor, not just an aesthetic one, and we cover it below.
Platform behavior. 60% of Gen Z couples use TikTok for wedding inspiration against 43% of Millennials, and 51% of Gen Z name Pinterest as their single most essential planning tool.
What this means if you are planning in 2027
If you are a Gen Z couple, the useful implication is that the national average describes a wedding priced for a cohort with roughly a decade more earning history than you have. A $32,000 wedding is not a compromise version of a $43,000 wedding. It is the median wedding for people your age, and there are more vendors building packages for it every year.
To improve your 2027 wedding budget, ensure that you are open to feedback and adjustments throughout the planning process.
If you are a Millennial couple, the useful implication runs the other way. Your peer group’s spending is well above the national average, and comparisons within your own social circle will pull your budget up rather than anchor it. The number that should govern your budget is your own income and savings, not what your friends spent.
Micro Weddings: What the Data Actually Says
Micro weddings, generally defined as 50 guests or fewer, are covered as a money-saving trend. The savings are real but smaller than advertised, for reasons we have already established.
At 40 guests, our model projects a total of about $17,134 and a cost per guest of about $428. At 117 guests, the total is about $37,281 and the cost per guest about $319. So the micro wedding costs about $20,000 less in total and about $109 more per guest.
Both facts are true and they lead to different conclusions depending on what you are optimizing for. If you want to spend less money, a micro wedding works and works dramatically. If you want your money to go further per person, it does not.
Where micro weddings save the most
The savings concentrate in catering, bar, rentals, and venue tier. They are largest when the smaller count moves you into a different category of venue rather than a smaller room in the same one. A 40-guest wedding in a restaurant’s private dining room has a genuinely different cost structure than a 40-guest wedding in a 200-capacity barn, even though both are 40-guest weddings.
Where micro weddings save less than expected
Understanding the factors affecting your 2027 wedding budget can help you make informed decisions that align with your financial goals.
Photography, videography, attire, rings, planning, stationery design, ceremony florals, and the officiant are essentially unchanged. That is our $6,668 floor, and at 40 guests it represents 39% of the total rather than 18%.
There is also a documented pattern of per-guest upgrading at small weddings. Couples hosting 40 people frequently upgrade the menu, the bar, and the favors precisely because they can, which recovers a portion of the savings. This is not a mistake, and for many couples it is the entire point. It is just worth planning for rather than being surprised by.
The honest version
A micro wedding is a good decision if you want a smaller wedding. It is a mediocre decision if you want a big wedding for less money, because what you get is a small wedding for less money, and those are different things. Plan the guest count you want first, then price it, rather than picking a count to hit a budget you have already committed to publicly.
Destination Weddings in 2027
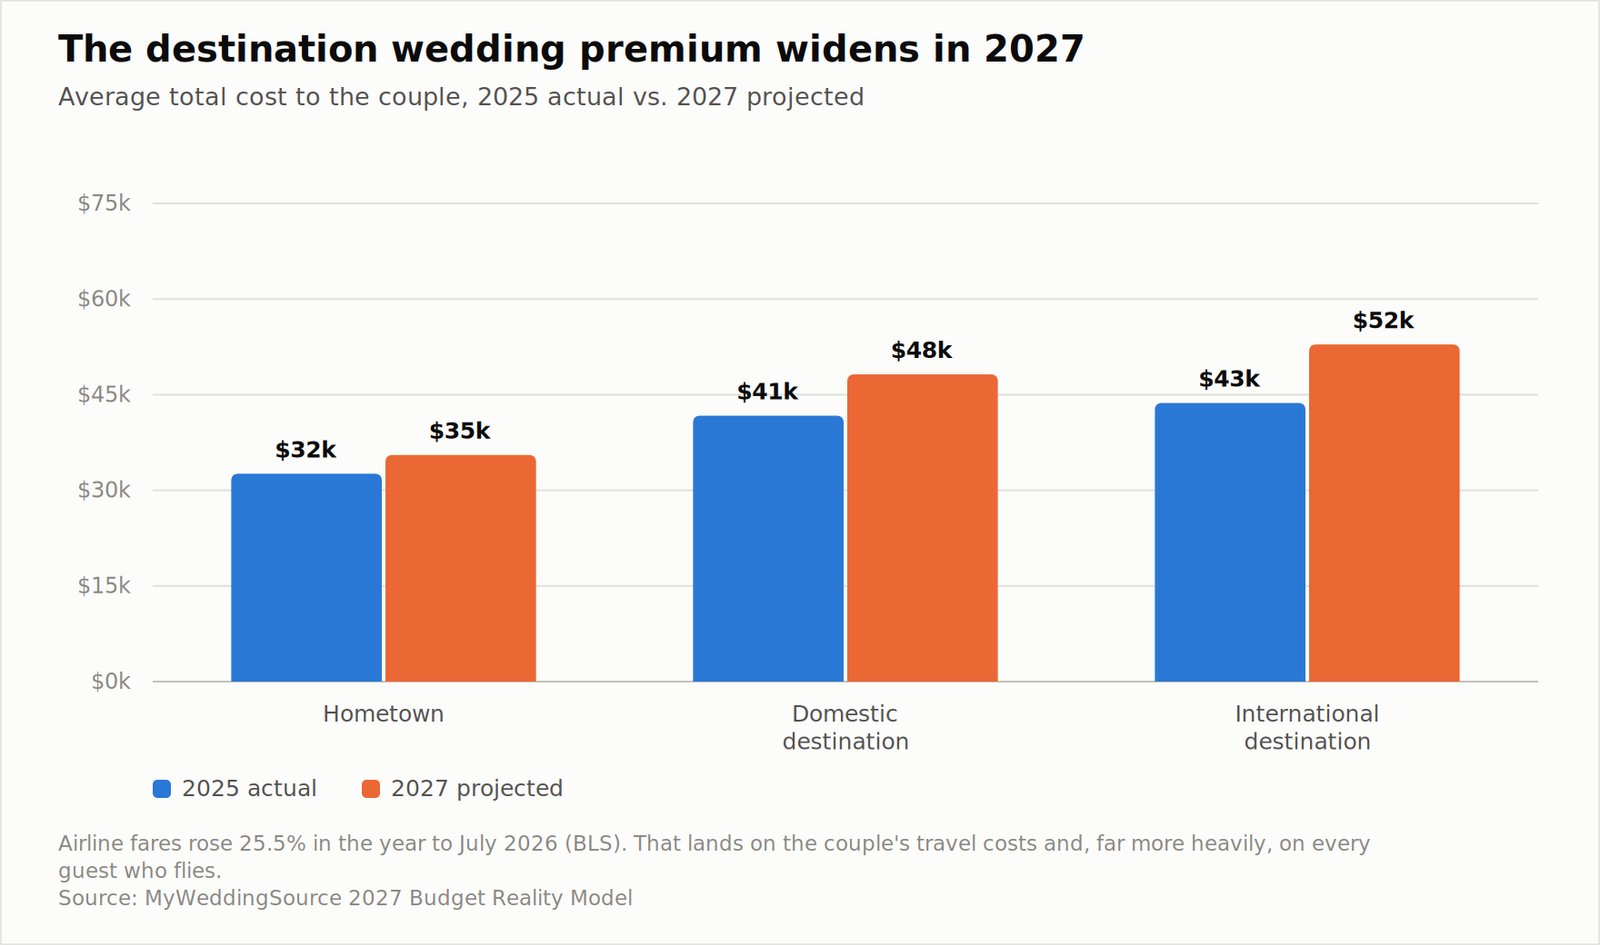
Destination vs hometown wedding cost, 2027
The Knot’s 2025 data puts a hometown wedding at $32,600, a domestic destination wedding at $41,700, and an international destination wedding at $43,700. Projected to 2027, those become roughly $35,537, $48,184, and $52,877.
The premium widens because destination weddings carry travel costs for the couple and their vendors, and airline fares rose 25.5% in the year to July 2026. That single BLS line does more damage to a destination budget than any other price movement in this report.
The persistent myth, and why it persists
Each decision made for your 2027 wedding budget has the potential to impact your overall experience on the big day.
Destination weddings are frequently described as cheaper because fewer guests attend. The data does not support that as a general rule. Domestic destination weddings run about 36% above hometown weddings in our 2027 projection, and international about 49% above.
The myth persists because it is true in a specific case: an all-inclusive resort package for 25 guests genuinely can cost less than a 130-guest hometown wedding. But that comparison is doing two things at once, reducing the guest count and changing the format, and attributing all of the savings to the destination is a mistake. Compare a 25-guest destination wedding to a 25-guest hometown wedding and the destination version is more expensive nearly every time.
The guest-side problem
This is the part that deserves more weight than it usually gets. A guest who flies to your wedding spends an average of about $1,680, against $270 for a local guest. Applying our travel-cost inflation, that flying guest is looking at roughly $2,000 in 2027.
Published survey data indicates 29% of Americans have skipped a wedding because of cost, and 54% feel weddings are becoming unaffordable to attend. A UK study found more than one in three declining destination wedding invitations specifically.
That is the real trade-off in a destination wedding, and it is not financial for you. It is a transfer of cost to the people you most want present, and a meaningful share of them will decline. If you go this route, the decisions that matter most are giving as much notice as possible, being explicit early that you understand not everyone can come, and resisting the impulse to read a decline as a statement about the relationship.
Second-Hand, Rented, and Resold: The Attire Math
Attire is the second-fastest-inflating category in our 2027 model at +6.5%, behind only flowers. Apparel CPI ran 3.9% in the year to July 2026, and bridal carries additional import exposure because the large majority of wedding gowns sold in the United States are manufactured abroad.
For many couples, managing their 2027 wedding budget presents unique challenges in the current economic climate.
Projected to 2027, our model puts attire at about $3,516 among couples who buy it, covering the gown or suit, the second partner’s attire, and alterations. Published data puts the gown alone at roughly $2,000 to $2,100 and alterations at roughly $550.
What resale actually saves
Second-hand gowns typically sell at 40% to 70% below retail. On a $2,100 gown, that is a saving of roughly $840 to $1,470.
There is a catch worth understanding before you count on the high end of that range. Alterations do not scale with the discount. A $2,100 new gown with $550 in alterations costs $2,650. The same gown bought second-hand at 60% off costs $840, but the alterations are often more expensive, not less, because a pre-owned gown was fitted to someone else and may need to be let out, taken in, or re-hemmed from a different starting point. Budget $700 to $900 rather than $550.
Net saving on that example: roughly $1,000 to $1,100, not the $1,260 the headline discount implies. Still a substantial saving on a single line item, and one of the more efficient trades available in a 2027 budget.
Where resale works best and worst
It works best for classic silhouettes in common sizes bought with enough lead time for two fittings, and for second partner attire, where a well-made suit bought second-hand or rented is nearly indistinguishable from new and where the resale market is less picked over.
It works worst under time pressure. A pre-owned gown bought eight weeks out is a risk, because if the alterations do not work there is no fallback. If your date is inside four months, buy new or rent from a business that guarantees fit.
As you prepare for your 2027 wedding budget, consider how societal trends may influence your overall spending.
The broader reuse trend
Bank of America’s data found more than 41% of wedding guests plan to repurpose clothing they already own rather than buy something new, with Gen Z more likely than other cohorts to rent or buy second-hand rather than reuse.
This has a quiet implication for couples setting a dress code. A strict formal or black-tie requirement is, in 2027, a request that a substantial share of your guests spend money they were planning not to spend. Published data indicates 46% of guests already reduced wardrobe spending for weddings due to economic pressure. A dress code stated as a preference rather than a requirement costs you nothing and saves your guests real money.
AI in Wedding Planning: Fast Adoption, No Savings
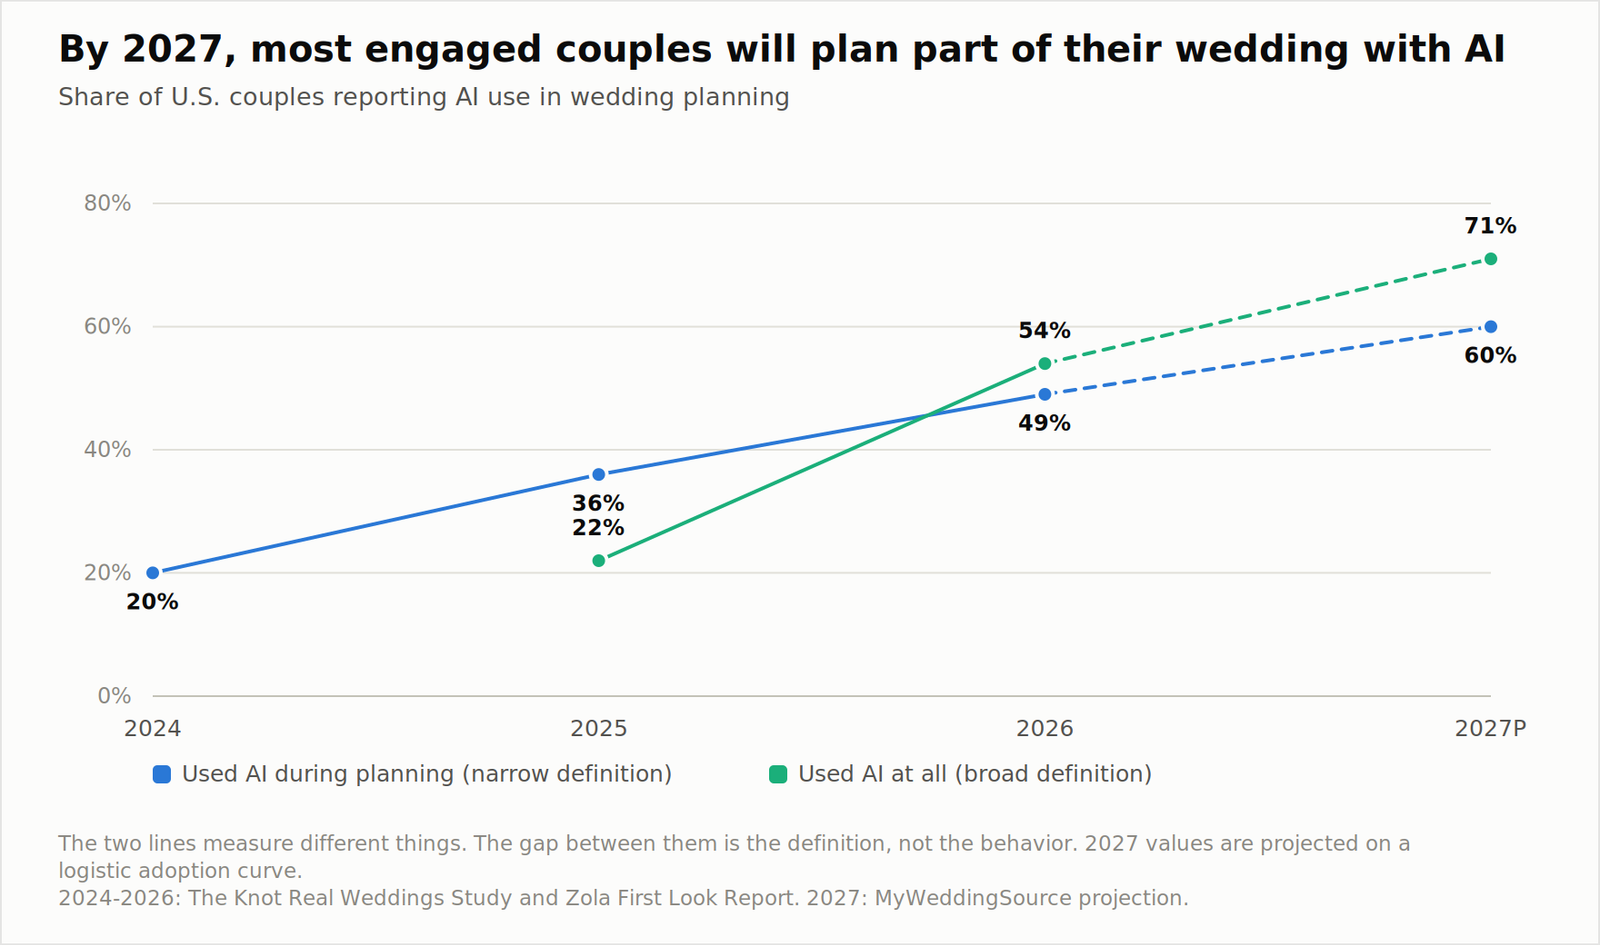
AI adoption in wedding planning, 2024 to 2027 projected
Two published figures on AI adoption look contradictory and are not. The Knot’s 2026 study reports 36% of engaged couples using AI, nearly double the prior year. Zola’s 2026 report puts it at 54%, with growth of nearly 150% year over year.
The gap is the question wording, not the behavior. A narrow question about using AI as a planning tool produces a lower number than a broad question about using AI at all during planning. Both are measuring a real and fast-moving trend.
Our projections put the narrow measure at about 60% and the broad measure at about 71% by 2027. On either basis, using AI somewhere in wedding planning becomes the majority behavior in 2027 rather than the exception.
What couples actually use it for
Utilizing tools and resources effectively can greatly enhance your ability to track and manage your 2027 wedding budget.
Zola’s breakdown is specific and useful: 54% use AI for etiquette questions, 44% for timelines, 40% for drafting vendor emails, and 31% for décor inspiration.
That list is notable for what is not on it. Couples are using AI for the administrative and informational parts of planning, and they are drawing firm lines around the personal parts. 63% say AI should not write vows, 44% exclude speeches, and 36% exclude ceremony scripts.
The finding that matters for your budget
As you navigate through the planning process, remember that the 2027 wedding budget should not only account for direct expenses but also consider guest-side costs that could arise. This awareness will help you maintain a realistic perspective on your finances and avoid unexpected financial strains.
Here is the part worth sitting with. AI adoption roughly doubled over a period in which wedding spending rose 8.5% year over year.
Whatever AI is doing for couples, it is not reducing what they spend. That should not be surprising. AI is good at drafting the email to the caterer and bad at telling you that the 22% service charge on the catering contract is negotiable in your market, which is where the actual money is.
If you want AI to help your budget rather than just your inbox, use it for the specific tasks where it does move numbers: building a comparison table of three venue quotes normalized to the same guest count and event length, generating the list of questions to ask before signing a contract, and cross-checking a proposal against a category checklist to find what has been left out. Those are the uses that catch the $4,900 service charge before it catches you.
TikTok, Pinterest, and the Inspiration Tax
From the beginning, maintain a clear focus on your 2027 wedding budget to ensure successful planning outcomes.
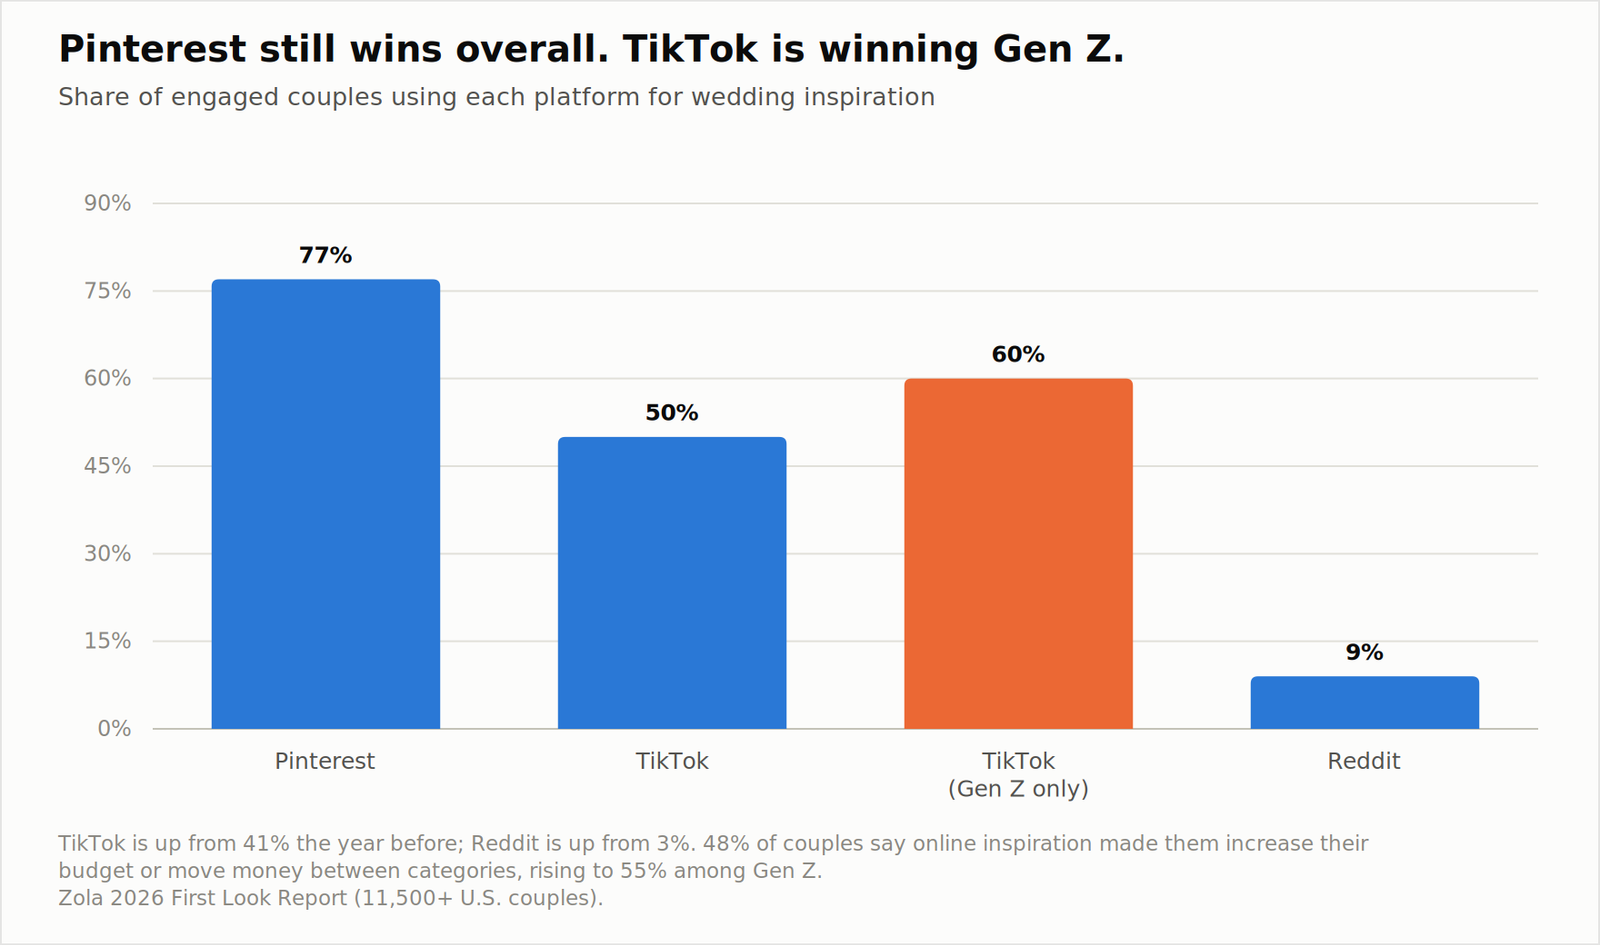
Where couples find wedding inspiration
Zola’s 2026 data contains one of the more directly budget-relevant findings in the entire body of published wedding research: 48% of couples increased their budget or moved money between categories because of something they saw online. Among Gen Z it is 55%.
Separately, 87% of couples report making planning decisions based on social media content, and 60% cite managing the gap between their budget and their inspiration as their single biggest planning stressor, up sharply from the prior year.
That last figure deserves attention. The number one reported source of wedding planning stress is not family conflict, not the guest list, and not the venue search. It is the distance between what couples have seen and what they can afford.
The platform split
Wedding Pinterest reaches 77% of couples, and 51% of Gen Z name it their single most essential planning tool. TikTok reaches 50% overall, up from 41% the prior year, and 60% among Gen Z. Reddit has tripled from 3% to 9%, with 10% of Millennials naming it their most valuable resource.
The Knot’s data notes TikTok usage in wedding planning has grown 2.5 times in recent years, while Pinterest remains the top platform overall.
The Reddit growth is small in absolute terms and interesting in kind. It is the only platform on the list where couples go primarily for cost information and vendor experiences rather than images, and its growth suggests couples are actively looking for a corrective to the visual platforms.
What the inspiration tax costs, concretely
Anticipating potential variations in your 2027 wedding budget will help you navigate financial uncertainties during planning.
If 48% of couples increase their budget because of online inspiration, and the average increase is even 10% of a $31,000 planned budget, that is roughly $3,100 per affected couple, or about $1,500 averaged across all couples. That is a quarter of the total reality gap.
We are not going to tell you to stop looking at wedding content. That is not realistic advice and it would not work. But there are two habits that measurably reduce the damage.
Price the image before you save it. When something goes on the board, spend two minutes estimating what it costs. An installation of hanging florals over a 24-foot table is a $3,000 to $6,000 item. A mood board where every pin is priced becomes a budget conversation instead of a source of vague dissatisfaction.
Separate the aesthetic from the execution. Most of what makes a wedding photograph well is light, framing, and a photographer who knows what they are doing, not the size of the floral installation. Couples routinely spend $4,000 on decor to produce an image that a better photographer would have produced from $1,200 of decor.
The Guest Side: The Half of the Wedding Economy Nobody Budgets For
Guest-side wedding cost vs couple cost
This is the finding we did not expect when we started building the model, and it may be the most useful one in the report for making decisions.
The Knot’s guest study found the average cost of attending a wedding at $610, broken down as $270 for a local guest, $840 for a guest who drives, and $1,680 for a guest who flies. Gifts average $150. A separate survey put the cost for a wedding party member at $1,131.
We modeled a travel mix calibrated to reproduce that $610 blended average, applied travel-cost inflation including the 25.5% rise in airline fares, and applied a household-sharing factor of 0.72 to account for the substantial share of guests who attend as a pair and split travel, lodging, and the gift.
Always reassess your 2027 wedding budget as you approach the date to make necessary adjustments and minimize surprises.
The result: a projected $494 in effective guest-side cost per guest in 2027, or about $57,846 across a 117-guest wedding.
That is 1.55 times what the couple spends on the wedding itself.
Why this changes decisions
It reframes several choices that otherwise look purely like matters of taste.
A Saturday evening wedding in a city with expensive hotels costs your guests substantially more than a Sunday afternoon wedding in the same city, and the difference for 117 guests runs into five figures of other people’s money.
A destination wedding does not reduce total spending. It relocates a large share of it onto your guests, which is why decline rates are high.
Multi-day wedding weekends, which Zola reports 18% of couples now planning, multiply guest-side cost. A welcome party on Friday and a brunch on Sunday means two additional hotel nights and two additional outfits for out-of-town guests. It is a genuinely lovely format and it is expensive for the people attending.
A large wedding party is the single most expensive thing you can ask of an individual guest, at roughly $1,131 in published data and more in 2027 terms. Gen Z’s revival of large wedding parties, at 92.2% inclusion, is a meaningful transfer of cost to friends.
When setting your 2027 wedding budget, be prepared to address potential conflicts that could arise in decision-making.
What to do with this
Nothing in this section is an argument for a smaller or cheaper wedding. It is an argument for making these choices with the full picture visible.
Three practices cost you nothing and save your guests real money. Give as much notice as possible, because flight prices reward early booking more than any other variable. Block rooms across at least two price tiers, since published data indicates 79% of guests choose accommodation primarily on price and a single luxury block leaves them nowhere to go. And state the dress code as a preference where you can, because 41% of guests are planning to wear something they already own and a rigid requirement quietly overrides that.
Fourteen Facts From the 2027 Data
Some of the more interesting things that surfaced while building this report, in no particular order.
1. If you added up every published category average, you would describe a wedding costing about $41,000 rather than the actual $34,200 average. The difference is that nobody buys every category.
2. The average couple hires 13 vendors. Every one of those is a separate contract, a separate deposit schedule, and a separate opportunity for a fee you did not price.
7. 1 in 6 couples now hires a wedding planner, often as part of managing their 2027 wedding budget effectively.
4. Lab-grown diamonds now account for 61% of engagement ring center stones, up 239% since 2020. Average carat size is 1.9. This is the only major wedding category where technology has meaningfully pushed prices down, and it is why our ring inflation projection is the lowest in the model at +2.8%.
5. May and October are the two peak wedding months in card-spending data, not June. May has held the top spot across a decade of transactions.
6. 76% of couples overspend on food and beverage relative to their plan, according to Splendid Insights’ survey of 53,493 couples. It is the single most reliably underestimated category in wedding budgeting.
7. 1 in 6 couples now hires a wedding content creator, a vendor category that essentially did not exist five years ago. It ranks last on our Cut Resistance Index at 18, which suggests it is the first thing to go when budgets tighten.
8. 57% of ultra-luxury couples negotiate with vendors, against 42% globally. The couples with the most money are the most likely to ask for a better price.
9. 59% of couples say a vendor’s willingness to negotiate affects whether they hire them. Asking is not rude; it is the majority behavior.
10. Only 13% of opposite-sex couples split the planning work equally, and 84% of women carry the majority of it. This is not a budget statistic, but it is the context in which most budget decisions get made.
11. Airline fares rose 25.5% in the year to July 2026, against overall consumer inflation of 3.4%. No other price series in this report moved anything like that far.
For those navigating a 2027 wedding budget, understanding your financing options can greatly influence your overall experience.
12. Roughly 80% of cut flowers sold in the United States are imported, which is why florals are the most tariff-exposed line in a wedding budget and why we project them inflating at nearly double the overall rate.
13. 10% of Zola’s respondents are currently using a GLP-1 medication and 54% of those say the wedding motivated the decision. Whatever else it is, this is now a real line in some couples’ pre-wedding spending, and it appears in no budget template.
14. About 31% of couples come in at or under budget in our model. The most common framing of wedding budgeting is that overspending is inevitable. For roughly one couple in three, it is not.
How to Build a 2027 Budget That Survives Contact With Reality
Everything above is diagnosis. This is the part you can act on.
Step 1: Start from your number, not the average
The national average is a market statistic. It is not a target and it is not a guide.
Your 2027 wedding budget should reflect both your style and the reality of what you can afford without compromising on essentials.
Start with what you can fund without borrowing, using three inputs: what you have saved and are willing to spend, what you can add from income between now and the wedding, and what family has committed in a specific dollar amount rather than a vague willingness to help. Add those three. That is your number.
Step 2: Apply the reality multiplier deliberately
If our model is right that the average couple finishes about 20% above plan, then a couple who wants to finish at $37,000 should plan a wedding at about $31,000 and hold the rest back.
This is not the same as adding a contingency line at the bottom of your spreadsheet, which almost always gets spent. It is planning the wedding itself at the lower number and treating the remainder as money that does not exist. The distinction matters more than it sounds like it should.
If you would rather not think in multipliers: plan the wedding you can afford at 80% of your total available funds.
Step 3: Price the venue and catering as one decision
Venue and catering together are 48.2% of the average wedding. They are usually contracted first and they are the largest single source of budget drift.
Before you sign anything, get a complete sample estimate at your actual guest count that includes food, beverage, staffing, rentals, service charge, gratuity, sales tax, ceremony fee, and any minimum spend. Then compare that total against the same total from your other options.
Consider the implications of your choices as you create your 2027 wedding budget to ensure a joyful experience.
Comparing per-person menu prices between venues tells you almost nothing. A venue at $95 per person with a 24% service charge and required rentals will cost more than a venue at $125 per person with everything included.
Step 4: Build the budget in three tiers
Ultimately, a well-structured approach to managing your 2027 wedding budget will set you up for success. By understanding the various factors at play and making informed decisions, you can create a memorable celebration that respects your financial constraints while still delivering an unforgettable experience.
Split every category into three tiers before you allocate a dollar.
Tier one, your top three. Fund these properly. Use the Cut Resistance Index as a starting point if you want, but your own ranking is the one that counts.
Tier two, everything necessary but not defining. Fund these at the market rate without upgrading.
Tier three, everything else. Fund these at the minimum, or not at all, and decide now rather than later.
The reason to do this at the start is that a budget without explicit priorities allocates by default, and the default hierarchy is the industry’s, not yours.
To effectively manage your 2027 wedding budget, regularly review your progress and make adjustments as necessary.
Step 5: Lock the guest list before you lock the venue
Guest-list growth is the second-largest source of overrun in our model, and it is the one most easily prevented by sequencing.
Agree with your partner on an invitation rule before you write any names down. Common rules that work: relatives you have spoken with in the past year, coworkers only if you see them outside work, no plus-ones for guests in relationships under a defined length, no one neither of you has met. The specific rule matters less than having one, because a rule survives a difficult family conversation and a case-by-case judgment usually does not.
Then add 10% for the names you have forgotten, because you have forgotten some.
Step 6: Track four numbers, not forty
Most wedding budget spreadsheets fail because they are too detailed to maintain. Track these four:
Committed. Contracts signed, whether or not paid. This is the only number that tells you your real position.
Paid. Cash out the door.
Your 2027 wedding budget should consider all aspects of your celebration, ensuring that no detail is overlooked.
Remaining. Your number minus committed.
Days to next payment. Because the failure mode is not overspending, it is a payment arriving before the money does.
Update it after every contract. Not weekly, not monthly. After every contract.
Step 7: Re-forecast at four months out
Four months before the date, sit down and re-forecast the total honestly. This is the point where most of the drift has happened but some of it is still reversible.
Ask three questions. What has already come in above estimate, and by how much? What is still unquoted? And what have we added since the original plan that we have not priced?
The couples in our 31% who finish at or under budget are, in the vendor accounts we have seen, overwhelmingly the ones who do some version of this check. It is not a complicated exercise. It just has to happen before the last payments are due rather than after.
As you finalize your planning, keep your 2027 wedding budget in focus to support a successful outcome.
Common Wedding Budget Mistakes That Cost the Most
These are the errors that show up most consistently in the data, framed as what happens, why it happens, and what to do instead.
Comparing per-person prices instead of total contract cost
What happens: A couple chooses the venue with the lower catering price per head and ends up paying more.
Why: Per-person price is the most visible number in a proposal and the easiest to compare. Service charges, minimums, required vendors, and rental gaps are in the fine print.
Consequence: Commonly $3,000 to $6,000, and it is discovered after the deposit.
Instead: Build a total-cost estimate for each venue at the same guest count and event length. Compare only the totals.
Treating the initial budget as fixed while quietly revising it
Highlighting essential elements within your 2027 wedding budget will guide your spending decisions effectively.
What happens: The budget rises by $1,500 four separate times and nobody registers that the number changed.
Why: Each revision is individually justified and none feels like a decision.
Consequence: The full $6,224 gap, arriving invisibly.
Instead: Keep the original number visible at the top of the spreadsheet permanently. Log every revision with a date and a reason. You may still revise it. You will at least know that you did.
Budgeting the wedding and forgetting the surrounding costs
What happens: The rehearsal dinner, the marriage license, the tips, the pre-wedding beauty and health spending, the day-after brunch, and the honeymoon deposit are not in the spreadsheet.
Why: Budget templates cover the wedding day.
Consequence: Roughly $4,000 to $9,000, depending on the honeymoon.
Ultimately, the key to a successful 2027 wedding budget lies in clarity and communication between partners.
Instead: Create a second, separate budget for everything that is not the wedding day itself, and fund it separately.
Assuming the guest list will not grow
What happens: A budget built for 100 becomes a wedding for 125.
Why: Family adds names after invitations become real, and plus-ones expand.
Consequence: About $6,550 at the 2027 marginal rate.
Instead: Build the budget at your target plus 10%, and agree on the invitation rule before writing the list.
Counting on registry cash funds to close a gap
What happens: Final payments are due before gifts arrive.
Being transparent about your 2027 wedding budget can foster a positive planning experience for you and your partner.
Why: Registry funds arrive around and after the wedding. Vendor balances are due 14 to 30 days before.
Consequence: Unplanned credit card use at exactly the moment you were trying to avoid it.
Instead: Treat registry funds as reimbursement, not funding. Plan the wedding as though they will arrive at zero.
Cutting the guest list as a last-minute fix
What happens: A couple cuts 15 guests eight weeks out to close a $4,800 gap and closes about $3,900 of it, at real relational cost.
Why: The per-guest average overstates marginal savings, and the catering minimum is already contracted.
Consequence: A partial fix and an awkward conversation.
Instead: Make guest-list decisions before the venue contract, when the count still changes which venues you are considering.
In the end, your 2027 wedding budget should reflect a celebration that is both meaningful and financially responsible.
Not asking about the service charge
What happens: A 20% to 24% service charge on food, beverage, and sometimes rentals appears as a line item after the couple has committed.
Why: It is disclosed but rarely emphasized, and it is not what most people mean by “gratuity.”
Consequence: Commonly $3,500 to $5,500.
Instead: Ask directly what the service charge percentage is, what it applies to, whether it is taxable in your state, and whether it goes to staff. Ask before the tour ends, not after.
Frequently Asked Questions
How much should I budget for a wedding in 2027?
Start with what you can fund rather than what the average is. Add your savings, the amount you can realistically add from income before the date, and any specific dollar commitments from family, then plan the wedding at about 80% of that total.
Remember, crafting your 2027 wedding budget is not just about the numbers, but also about creating lasting memories.
The national projection of $37,281 tells you what the market average will be. It does not tell you what a wedding in your city, at your guest count, on your date will cost. A 90-guest Friday wedding in Ohio and a 140-guest Saturday wedding in New Jersey are both “average” weddings in the sense that they exist, and they are $30,000 apart.
If you want a rough starting figure for your own market, take your regional projection from the table above and adjust for guest count using the fixed-plus-variable model: about $6,700 fixed, plus about $262 per guest, adjusted up or down for your region’s cost level.
Is $30,000 a realistic wedding budget for 2027?
Yes, comfortably, for most of the country. It is below the projected national average but well within normal, and it is above the median for Gen Z couples, 43% of whom plan under $20,000.
At $30,000 in a mid-cost market you can host roughly 90 to 100 guests with a professional photographer, catered food, a bar, a DJ, and florals, without cutting anything a guest would notice.
In the Mid-Atlantic or New England, $30,000 buys a meaningfully smaller wedding, roughly 55 to 70 guests, or a Friday or Sunday date, or a non-peak month. That is a real constraint, not a failure of planning.
Why do so many couples go over budget?
Mostly because the budget is set before enough information exists to set it accurately. You have to pick a venue before you have catering quotes, and the venue determines a large share of the catering cost.
As you navigate your 2027 wedding budget, maintain flexibility and adaptability to manage any unexpected challenges.
Beyond sequencing, the five recurring causes in our model are service charges and taxes that were not in the compared price, guest-list growth after the budget was set, small upgrades accumulating in the final months, overtime and day-of costs, and personal or surrounding expenses that never made it into the spreadsheet.
Almost none of these are carelessness. They are structural features of how weddings are priced and planned, which is why the overrun rate is 69% rather than something closer to random.
Do I actually save money with a smaller guest list?
Yes, but about 80% of what a per-guest calculation suggests. In our 2027 model, each guest removed saves roughly $262 rather than the $319 you get by dividing the total by the head count. About $6,700 of the wedding does not shrink at all.
Guest-list cuts are most effective when they are large, when they happen before contracts are signed, and when they move you below a venue capacity tier or a catering minimum. They are least effective as a late fix for a small gap.
Should we use a credit card or a personal loan for wedding costs?
That depends more on your repayment plan than on the instrument. About 67% of newlyweds take on some wedding-related debt, so you would not be doing anything unusual either way.
A credit card is reasonable if you can clear the balance within a few months, and it can be advantageous if you are earning rewards on spending you were going to do anyway. It becomes expensive quickly if the balance revolves, since card rates are far above personal loan rates.
In summary, a well-planned 2027 wedding budget will enhance your celebration and ensure a positive experience for all.
A personal loan generally carries a lower rate and a fixed payoff date, which is its main advantage: it forces the plan that a credit card lets you avoid making.
We are not financial advisors and this is not financial advice. The one thing we would say confidently is that if you cannot name the month the balance reaches zero, the amount is larger than it should be.
How much do wedding guests actually spend to attend?
Published data puts the average at $610 per guest, with local guests around $270, guests who drive around $840, and guests who fly around $1,680. Wedding party members average about $1,131.
Applying travel inflation and adjusting for guests who attend as a pair and share costs, we project an effective average of about $494 per guest in 2027, or roughly $57,846 across a 117-guest wedding.
That is about 1.55 times what the couple spends. It is worth knowing when you set the date, the location, and the dress code, since all three move that number for everyone attending.
Are destination weddings cheaper?
Not as a rule. Our 2027 projections put a domestic destination wedding at about $48,184 and an international one at about $52,877, against about $35,537 for a hometown wedding.
Ultimately, the goal of your 2027 wedding budget is to create a celebration that encapsulates your vision and values.
They can cost the couple less in the specific case where the format also reduces the guest count dramatically, such as a 25-guest resort package. But that is the guest count doing the work, not the destination.
The larger consideration is that destination weddings shift substantial cost onto guests, at roughly $2,000 per person who flies in 2027 terms, and decline rates are correspondingly high.
What is the fastest-rising wedding cost going into 2027?
Flowers, at a projected +7.5%, followed by attire at +6.5%. Both are import-exposed in a way that general inflation figures do not capture, with roughly 80% of U.S. cut flowers imported and most bridal gowns manufactured overseas.
Outside the wedding budget itself, airline fares rose 25.5% in the year to July 2026, which affects destination weddings and every out-of-town guest.
The slowest-rising category is wedding rings at a projected +2.8%, held down by lab-grown stones now accounting for 61% of engagement ring center stones.
Should we hire a wedding planner if money is tight?
It is worth pricing rather than dismissing, and the middle options are the ones most couples overlook.
Full-service planning at roughly $2,271 in 2027 terms is a real expense on a tight budget. But partial planning and month-of coordination packages typically run a fraction of that, and their main function is preventing exactly the late-stage cost creep and overtime charges that produce the reality gap.
If you are planning a wedding with more than about 100 guests, multiple vendors, and a venue that does not provide a coordinator, the question is not whether you can afford coordination. It is whether you can afford to be the coordinator on the day, which has its own cost.
How do we handle a parent who wants to contribute but also wants to invite people?
Have the conversation about expectations before the contribution, not after, and make it about the guest list specifically rather than about control in general.
A useful framing: “We would love your help, and we want to be upfront that each additional guest costs about $260 once food, drinks, and rentals are counted. Can we agree on a number of names now so we can build the budget around it?”
That converts an emotionally loaded conversation into an arithmetic one, which is usually easier for everyone. It also protects the contribution from becoming a source of resentment on either side, which is the actual risk, and family disagreements about wedding costs are common enough that it is worth pre-empting.
Is it worth waiting until 2028 to get married if costs are rising?
Probably not on cost grounds alone. Our model projects wedding costs rising at about 4.4% per year, which means waiting a year to save money means paying about 4.4% more. Waiting only helps if you use the extra year to save meaningfully more than that, which is a question about your savings rate rather than about wedding prices.
Waiting can make sense for other reasons: a longer runway gives you access to better dates, more vendor availability, and more time to shop carefully, and published data suggests 51% of couples save for years before even getting engaged. But “prices will come down” is not a reason our data supports.
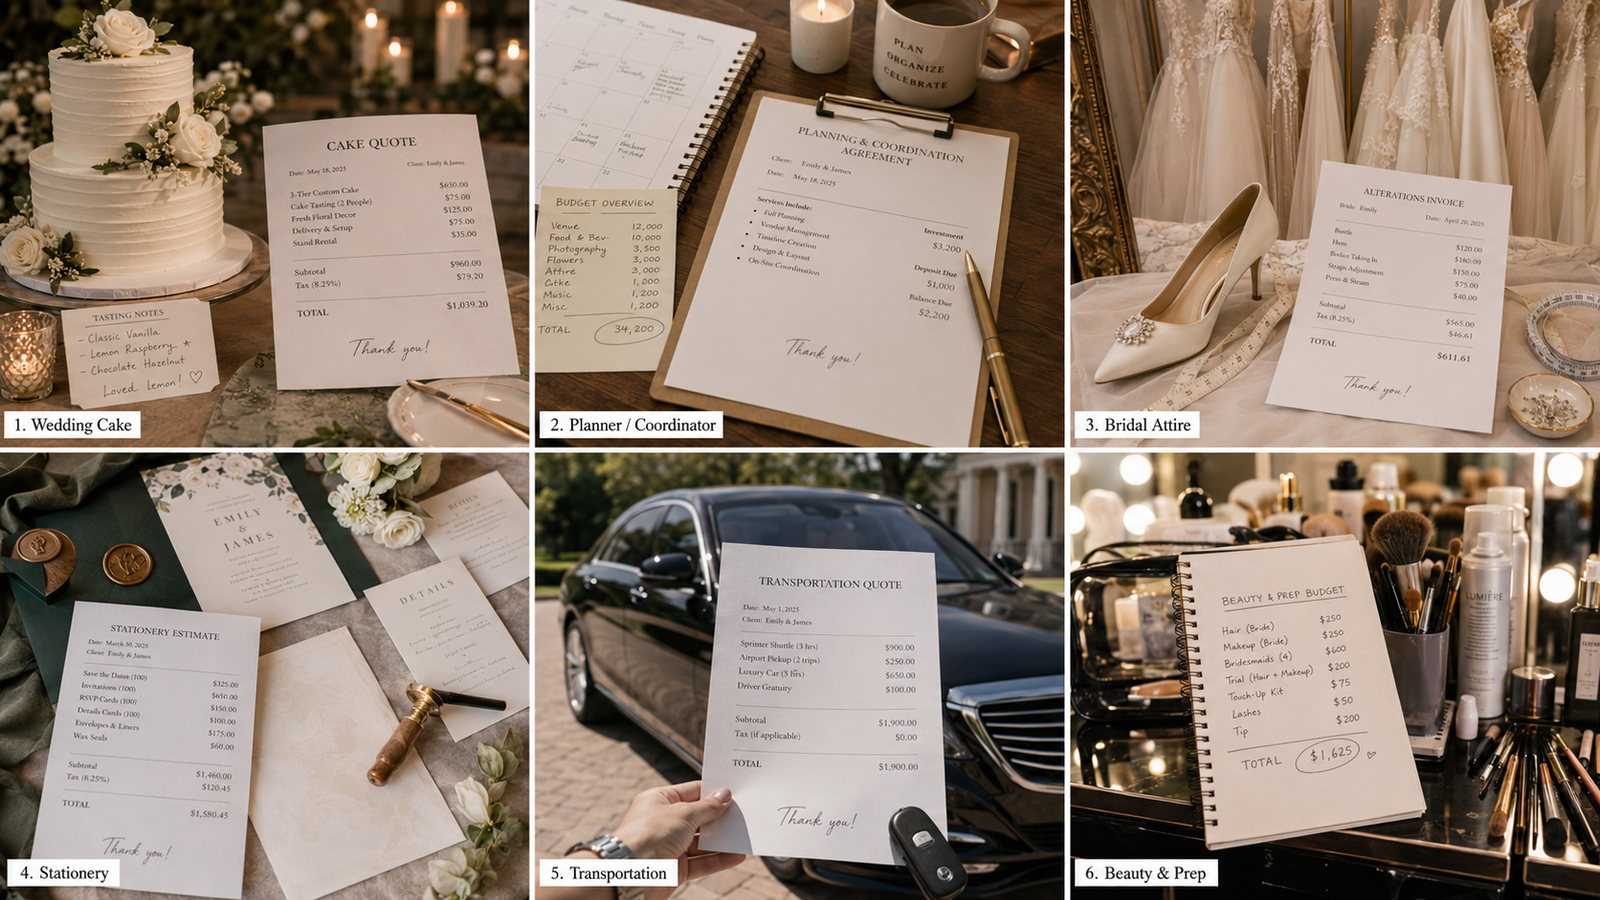
The One Principle That Closes the Gap
The finding underneath every number in this report is that the average couple does not blow their wedding budget. They revise it, in small increments, over a period of months, and each individual revision is reasonable.
That is genuinely good news, because a problem made of five ordinary causes is easier to solve than a problem made of one catastrophic one. You do not need more discipline. You need the original number to stay visible, the venue and catering contract to be evaluated as a total rather than a per-person rate, the guest list to be settled before the venue rather than after, and one honest re-forecast at four months out.
Those four practices are what separates the 31% of couples who finish at or under budget from the 69% who do not. None of them requires spending less on the things you care about. They just require the budget to be a thing you can see rather than a thing you remember approximately.
For 2027 specifically, plan against $37,281 as the national average, expect your own number to be meaningfully different depending on your region and guest count, and set your working budget at about 80% of what you can actually fund. Watch flowers and attire, which are inflating fastest. Ask every venue directly about the service charge before you leave the tour. And when you weigh a date, a location, or a dress code, remember that the people attending are collectively spending about one and a half times what you are.
Your next step
Before you contact a single vendor, do this one exercise with your partner.
Write down the total you can fund, from savings, income, and specific family commitments. Multiply it by 0.8. That is your working budget. Then rank your top three categories, without discussing money, and compare your lists.
If your lists differ, you have found the most important budget conversation of your entire planning process, and you have found it at the point where it is still cheap to have.
Sources and Methodology Notes
Published data used in this report:
- The Knot 2026 Real Weddings Study — 10,474 U.S. couples married in 2025. Average cost, guest count, cost per guest, vendor hire rates, category averages, regional and generational breakdowns, cost by who pays, cost by guest-count bracket, AI adoption, lab-grown diamond share.
- Zola 2026 First Look Report — 11,500+ U.S. couples. Average cost, guest count, funding sources, AI use cases, platform usage, Gen Z vs. Millennial behavior, budget-overrun share, registry cash funds, self-care spending.
- Bank of America Institute, “Weddings: Putting a price on love,” June 2026 — card, debit, and ACH transaction analysis. Year-over-year spending growth, regional growth patterns, generational volume shifts, seasonality, guest attire reuse, tariff exposure.
- LendingTree newlywed wedding debt survey — 1,050 U.S. newlyweds, conducted March 12–19, 2025 by QuestionPro. Debt incidence, financing mix, budget overrun self-reports, financial stress and conflict.
- U.S. Bureau of Labor Statistics, Consumer Price Index, July 2026 — all items, food away from home, apparel, services less energy services, transportation services, airline fares.
- The Knot Guest Study — 1,000 U.S. adults who attended weddings in 2024. Guest cost by travel type, gift averages, accommodation decision factors.
- DatingNews survey, July 2024 — 1,024 U.S. adults. Declined invitations due to cost, guest and wedding party spending.
- Splendid Insights / Think Splendid wedding market research — 53,493 couples surveyed globally. Budget doubling incidence, food and beverage overspend, vendor negotiation behavior, content creator adoption.
MyWeddingSource modeling:
All 2026 and 2027 figures, the Cut Resistance Index, the budget-overrun distribution, the fixed-versus-variable cost split, the category participation rates beyond venue, photographer, and caterer, the category inflation rates, the guest travel mix, and the household-sharing factor are outputs of the MyWeddingSource 2027 Budget Reality Model. Assumptions are stated where each figure appears.
Projections are estimates, not forecasts of what any individual wedding will cost. They describe a national average under stated assumptions about inflation, tariffs, and behavior. Your own costs will differ, in some markets substantially.
